Open Access
Fig. 18.
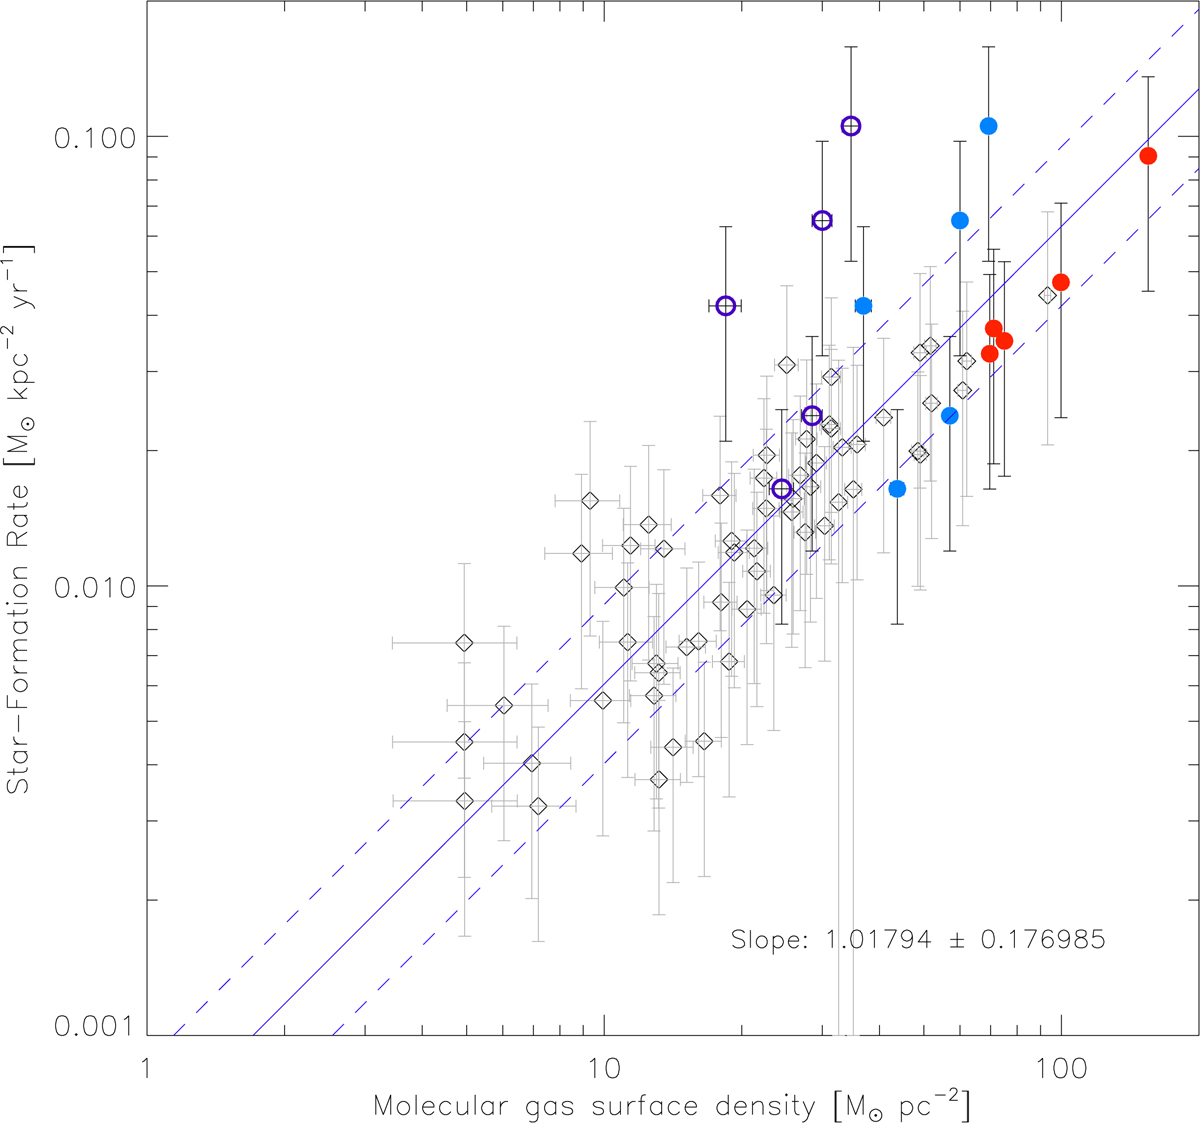
Star-formation rate ![]() as a function of the molecular gas surface density ΣH2. Light blue points correspond to the high H I surface density region with αCO = 2 ×
as a function of the molecular gas surface density ΣH2. Light blue points correspond to the high H I surface density region with αCO = 2 × ![]() . Dark blue circles correspond to αCO =
. Dark blue circles correspond to αCO = ![]() . Red points corresponds to the galaxy center. The dashed lines correspond to ±1σ.
. Red points corresponds to the galaxy center. The dashed lines correspond to ±1σ.
Current usage metrics show cumulative count of Article Views (full-text article views including HTML views, PDF and ePub downloads, according to the available data) and Abstracts Views on Vision4Press platform.
Data correspond to usage on the plateform after 2015. The current usage metrics is available 48-96 hours after online publication and is updated daily on week days.
Initial download of the metrics may take a while.