| Issue |
A&A
Volume 645, January 2021
|
|
|---|---|---|
| Article Number | L2 | |
| Number of page(s) | 6 | |
| Section | Letters to the Editor | |
| DOI | https://doi.org/10.1051/0004-6361/202038532 | |
| Published online | 21 December 2020 | |
Letter to the Editor
The star cluster age function in the Galactic disc with Gaia DR2
Fewer old clusters and a low cluster formation efficiency
1
Dept. FQA, Institut de Ciències del Cosmos, Universitat de Barcelona (IEEC-UB), Martí i Franquès 1, 08028 Barcelona, Spain
e-mail: This email address is being protected from spambots. You need JavaScript enabled to view it.
, This email address is being protected from spambots. You need JavaScript enabled to view it.
2
ICREA, Passeig Lluis Companys 23, 08010 Barcelona, Spain
Received:
29
May
2020
Accepted:
27
November
2020
Abstract
We perform a systematic reanalysis of the age distribution of Galactic open star clusters. Using a catalogue of homogeneously determined ages for 834 open clusters contained in a 2 kpc cylinder around the Sun and characterised with astrometric and photometric data from the Gaia satellite, we find that it is necessary to revise earlier works that relied on data from the Milky Way Star Cluster survey. After establishing age-dependent completeness limits for our sample, we find that the cluster age function in the range 6.5 < log t < 10 is compatible with Schechter-type or broken power-law functions. Our best-fit values indicate an earlier drop of the age function (by a factor of 2−3) with respect to the results obtained in the last five years, and are instead more compatible with results obtained in the early 2000s along with radio observations of inner-disc clusters. Furthermore, we find a typical destruction timescale of ∼1.5 Gyr for a 104 M⊙ cluster and a present-day cluster formation rate of 0.55−0.15+0.19 Myr−1 kpc−2, suggesting that only 16−8+11% of all stars born in the solar neighbourhood form in bound clusters. Accurate cluster-mass measurements are now needed to place more precise constraints on open-cluster formation and evolution models.
Key words: open clusters and associations: general / Galaxy: evolution / solar neighborhood / methods: statistical / methods: data analysis
© ESO 2020
1. Introduction
It is becoming increasingly difficult to understand the formation of galaxies without taking into account several levels of baryonic hierarchical structure formation. To unravel the formation history of the Milky Way disc, however, it is often useful to study open star clusters (OCs): groups of stars of the same age and abundance pattern held together by mutual gravitation.
The physical processes governing the formation and evolution of OCs are encoded in the distribution of their properties, including mass, age, and size (for a recent review, see Krumholz et al. 2019). Since it is relatively easy to estimate at least differential ages for OCs, one of the key observables of the local OC population is the completeness-corrected age distribution (e.g. Wielen 1971; Janes et al. 1988; Battinelli & Capuzzo-Dolcetta 1991; Lamers et al. 2005; Piskunov et al. 2006, 2018; Morales et al. 2013; Krumholz et al. 2019). This cluster age function (CAF) can be thought of as an integral of the cluster distribution function over several other parameters, such as present-day mass, initial mass, internal rotation, and binary fraction, which are much more difficult to determine.
In the Milky Way, the census of OCs is highly incomplete, at least beyond a local volume of 1−2 kpc (Kharchenko et al. 2013). Thanks to the unprecedented quality of the astrometric and photometric data released with the Gaia second data release (DR2; Gaia Collaboration 2018), hundreds of new clusters have recently been detected even at smaller distances (e.g. Cantat-Gaudin et al. 2018, 2019; Castro-Ginard et al. 2019, 2020; Liu & Pang 2019; Sim et al. 2019). In addition, some analyses have shown that previous catalogues also contained large numbers of false positives and asterisms (Cantat-Gaudin et al. 2018; Cantat-Gaudin & Anders 2020). The impact of Gaia on the field of Galactic cluster studies can thus hardly be overestimated.
The main remaining challenges for obtaining a clean and unbiased CAF for the Milky Way (or at least for the local solar neighbourhood of a few kiloparsec) are (a) the irregular dust distribution in the Galactic disc; (b) the intrinsically patchy distribution of star clusters and other young disc tracers (Becker 1963; Becker & Fenkart 1970; Efremov 2010; Moitinho 2010; Cantat-Gaudin et al. 2018; Reid et al. 2019; Skowron et al. 2019), rendering completeness estimates difficult; (c) the smooth transition between moving groups, associations, and physically bound OCs (Krumholz et al. 2019; Kounkel & Covey 2019; Cantat-Gaudin & Anders 2020; Kounkel et al. 2020); and (d) the availability of homogeneously derived cluster parameters.
The last problem has recently been addressed by Cantat-Gaudin et al. (2020, hereafter CGa20) who published a catalogue of homogeneous age estimates for 1867 Galactic OCs confirmed by Gaia DR2. In this Letter, we use that catalogue to reevaluate the CAF of the Milky Way CAF. Our figures (including the completeness analysis) are reproducible via the python code provided online1.
2. The Gaia DR2 open-cluster census
The precise Gaia DR2 astrometry (positions, proper motions, and parallaxes) allows for detections of OC members (including their tidal tails; Röser et al. 2019; Röser & Schilbach 2019) and the discovery of thousands of new clusters and moving groups almost entirely from proper-motion measurements (e.g., Gaia Collaboration 2018; Cantat-Gaudin et al. 2018; Kounkel & Covey 2019; Meingast et al. 2019). The Gaia photometry (Evans et al. 2018) allows us to characterise these objects in detail through their colour-magnitude diagrams.
In this work, we used the homogeneously derived parameters for 1867 Gaia-detected clusters recently published by CGa20. For that catalogue, the main cluster parameters age, distance modulus, and extinction were computed from the observed Gaia DR2 parallaxes and G versus (GBP − GRP) colour-magnitude diagrams by a multi-layer-perceptron neural network trained on a set of 347 OCs with well-determined parameters (primarily from Bossini et al. 2019). The cluster membership lists were mostly taken from Cantat-Gaudin & Anders (2020) and Castro-Ginard et al. (2020). The typical log t uncertainties derived by the neural network amount to 0.15−0.25 for clusters younger than 300 Myr, and 0.1−0.15 for clusters older than that. For details of the method, we refer to CGa20.
Recent studies of the CAF (Joshi et al. 2016; Piskunov et al. 2018; Krumholz et al. 2019) have relied on the cluster data compiled in the latest version of the Milky Way Star Cluster survey (MWSC; Kharchenko et al. 2016). A substantial fraction of objects contained in this catalogue, however, could not be confirmed with Gaia DR2 (Cantat-Gaudin et al. 2018; Cantat-Gaudin & Anders 2020); all the putatively old, high-latitude, inner-galaxy OC candidates, many dubious New General Catalogue (NGC; Dreyer 1888) objects, and about 50% of the old nearby FSR cluster candidates of Froebrich et al. (2007) are among the objects that could not be confirmed. In the following analysis, we thus compare our Gaia results both to the Kharchenko et al. (2013) version of the MWSC and to the latest version of that survey.
To illustrate the transformative power of Gaia DR2 on the field, Fig. 1 compares the distribution of OCs in heliocentric Cartesian coordinates derived from the MWSC catalogue with the distribution obtained from the new catalogue of Gaia-detected OCs of CGa20. For a deeper discussion of the structures emerging from this figure, we refer to the latter paper. Our main objective is to estimate the (age-dependent) completeness of the new catalogue to determine the CAF.
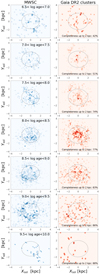 |
Fig. 1. Galactic distribution of the OC samples studied in this Letter, sliced into logarithmic age bins. Left: pre-Gaia census using the MWSC catalogue (Kharchenko et al. 2013). Right: post-Gaia DR2 census, using the catalogue of Cantat-Gaudin et al. (2020). In each panel we show a 2D kernel density estimate with a fixed bandwidth of 0.05 kpc. For the MWSC, the dashed circle corresponds to the completeness limit of 1.8 kpc used in the literature (e.g., Piskunov et al. 2018); for the Gaia DR2 census, a sample limit of 2 kpc is used together with age-dependent completeness fractions indicated in each panel (see Sect. 2, last paragraph). |
To correct for our incomplete view of the Galactic OC population, we need to quantify how selection biases affect our samples. The different aspect of the OC distributions in the right column of Fig. 1 already suggests that the present Gaia DR2 census is unlikely to be complete to a fixed limit, as was frequently assumed for the MWSC catalogue (the dashed grey circle in the left-column panels denotes the 1.8 kpc completeness limit used by Kharchenko et al. 2016; Joshi et al. 2016; Piskunov et al. 2018).
In this work, we estimate the age-dependent completeness of the Gaia DR2 cluster census within a cylinder of radius dxy = 2 kpc (right column of Fig. 1). The analysis can be retraced in more detail in Appendix A. In a nutshell, we take into account two effects. First, to account for undetected clusters, we use the OC recovery experiment performed for the latest Galactic-plane OC search of Castro-Ginard et al. (2020) to estimate the detection efficiency of their conservative method as a function of distance, sky region, and age. The second incompleteness effect stems from uncharacterised clusters: it was not possible to infer physical parameters in CGa20 for all Gaia-detected OCs. Within the 2 kpc cylinder, however, this effect is minor: only 32 non-characterised clusters have Bayesian parallax distances smaller than 2 kpc. Estimating their age distribution using the values of Kharchenko et al. (2013), we find that they are mostly younger than log t = 7.5. The combined completeness fractions for each age bin are given in Fig. 1.
3. The post-Gaia DR2 cluster age function
Having established the completeness limits of the Gaia DR2 cluster sample, we can now determine the age distribution and the CAF. The top panel of Fig. 2 shows the histogram and a kernel density estimate of the logarithmic age distribution for the Gaia DR2 census within a 2 kpc cylinder around the Sun. For comparison, we also show the results obtained with the original MWSC catalogue (Kharchenko et al. 2013) and the latest version used by Piskunov et al. (2018) and Krumholz et al. (2019). From Fig. 2 we can already appreciate some important differences to these pre-Gaia works. The peak of the distribution lies around log t ∼ 8.2, and although the Gaia census is much more complete for old OCs, we see a lot less of those objects.
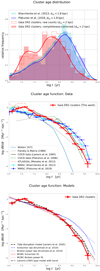 |
Fig. 2. Age distribution for Galactic open clusters in the solar vicinity. Top panel: normalised histograms and kernel-density estimates. The cyan and blue distributions show the results from the MWSC survey (Kharchenko et al. 2013; Piskunov et al. 2018, respectively); the red distribution shows our Gaia DR2-derived results. Middle and bottom panels: observational CAF determinations for the extended solar neighbourhood, from Wielen (1971) to our completeness-corrected Gaia DR2-based census (red). Error bars include Poissonian uncertainties in the number of clusters per bin and systematic uncertainties from the completeness correction (see Appendix A). Bottom panel: CAF comparison to models, as indicated in the legend. |
The typical metric for the cluster age distribution, used both by the Galactic and the extragalactic community, is the CAF, which is the number of clusters per unit of age in logarithmic age bins. Following the method of Piskunov et al. (2018), we derived the CAF for the MWSC and the Gaia samples. Our results are shown in the middle panel of Fig. 2. In this panel, we also show some of the literature results compiled by Piskunov et al. (2018): namely Wielen (1971), Pandey & Mahra (1986), Lamers et al. (2005), Piskunov et al. (2006), and Morales et al. (2013).
In the bottom panel of Fig. 2, we compare our data to several models. In particular, these are two of the cluster destruction models presented by Lamers et al. (2005), a fit to the Lamers & Gieles (2006) model, and the results of our fits to two simple analytical functions; these are all performed with the Markov chain Monte Carlo sampler emcee (Foreman-Mackey et al. 2013).
We confirm the conclusion of Krumholz et al. (2019) that the Milky Way CAF is closely fitted by a Schechter function or a broken power law. The fit parameters for those functions, however, have to be revised. In particular, we obtain best-fit values of 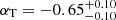 ,
, 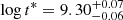 for the Schechter case (Krumholz et al. 2019: αT = −0.55, log t* = 9.59), and
 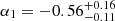 ,
,  ,
,  for the case of a broken power law (Krumholz et al. 2019: α1 = −0.61, α2 = −1.67, log tbreak = 8.89). Our basic conclusion is that the downturn in the CAF occurs at lower ages (by a factor 2−3) and the slope beyond the break is steeper.
4. Discussion
The CAF is the marginalised probability distribution of the full Galactic OC distribution function. Until the first mass estimates for Gaia clusters become available, it is our best tool to study the physics of OC formation and destruction. The new homogeneous age catalogue of Gaia DR2-detected OCs of CGa20 allows us to probe this observable with better precision and accuracy than ever before.
Our measurements, summarised in Fig. 2, rule out the old-age-heavy CAF obtained in recent years from the MWSC catalogue, which contains a significant number of allegedly old false positives. Instead, our new CAF determination is in line with earlier measurements (e.g. Lamers et al. 2005; Piskunov et al. 2006; Morales et al. 2013; for a detailed discussion of the history of Milky Way CAF measurements, we refer to Sect. 3.3 of Piskunov et al. 2018).
This also implies that some cluster formation and destruction models from the pre-MWSC era are still compatible with our measurements. In particular, this is the case for the model of Lamers et al. (2005) with a typical destruction timescale for a 104 M⊙ OC of t4 ∼ 1.5 Gyr, which we show in Fig. 2. Those authors modelled the cluster destruction as tdis ∝ t4 ⋅ (Mini/104 M⊙)γ, with γ ≈ 0.62 and a star formation rate in clusters of ∼500 M⊙ Myr−1 kpc−2. Surprisingly, almost all of our CAF data points (except for the lowest age bin) are consistent with the Lamers et al. (2005) model within 1σ. In addition, in accordance with Morales et al. (2013), we find a hint of a short bump in the cluster formation rate at very young ages, around 6−20 Myr (dash-dotted curve in Fig. 2). The proximity of our data to the CAF obtained by Morales et al. (2013) from ATLASGAL radio data (Schuller et al. 2009) of mostly embedded clusters towards the inner Galaxy also suggests little change in the cluster destruction rate within a few kiloparsec from the Sun.
Lamers & Gieles (2006) parametrised the destruction time of initially bound OCs in the solar neighbourhood, taking into account four processes in the life of OCs: stellar evolution, tidal disruption by the Galactic gravitational field, shocking by spiral arms, and (most importantly) encounters with giant molecular clouds. These authors showed that the observed CAF depends on the destruction timescale, the cluster formation rate, and the cluster initial mass function. In the absence of cluster masses, however, we find that these parameters are still degenerate and thus refrain from reporting fit values for such a model. The current cluster formation rate can in principle be read off the lowest age bin ( Myr−1 kpc−2); this value, however, is most affected by our completeness corrections and should be treated cautiously.
To convert the cluster formation rate to the star formation rate in clusters, we assume a mean initial mass of ∼300−600 M⊙; the exact value depends on the cluster initial mass function and the lower-mass limit of our sample. Assuming this mean initial mass, we obtain a star formation rate in clusters of  M⊙ Myr−1 kpc−2, which, when compared to the total star formation rate in the solar vicinity (
 M⊙ Myr−1 kpc−2; Mor et al. 2019), suggests that only
  % of the stars in the solar vicinity form in bound clusters (see also Adamo et al. 2020; Ward et al. 2020).
Krumholz et al. (2019, Sect. 2.3) reviewed determinations of the CAF for external galaxies (based on unresolved cluster observations) and compared these determinations to the local CAF obtained from the Piskunov et al. (2018) data. These authors note that the typical power-law index αT for the Milky Way seemed to steepen quickly around ages of ∼109 Gyr, in stark contrast to other galaxies (their Fig. 6). Our revised OC census based on Gaia DR2 seems to bring the Milky Way back in line with most other spiral galaxies, including M 31, for the age range 7.5 < log t < 9.5.
The comparison to extragalactic samples, however, is still biased in two other ways (Krumholz et al. 2019): first, our Milky Way sample is still limited to ∼2−3 kpc from the Sun and consists entirely of low-mass clusters (M ≲ 103 M⊙), while extragalactic samples are dominated by the most massive clusters (usually M > 103.5 M⊙). Second, ages for extragalactic clusters are derived from integrated photometry, whereas ours have been derived from high-precision Gaia DR2 colour-magnitude diagrams and parallaxes, thus making our measurement a new benchmark for extragalactic studies as well.
We look forward to the next Gaia data releases, which will enable an even deeper characterisation of thousands of Galactic open clusters, eventually also allowing for precise determinations of cluster masses. The joint mass and age distribution of the Milky Way, as well as variations in the CAF as a function of position in the Galaxy, will then allow us to test the limits of the most updated cluster formation and destruction models.
Acknowledgments
We thank Mercè Romero-Gómez and Cesca Figueras for their comments. This work has made use of data from the European Space Agency (ESA) mission Gaia (www.cosmos.esa.int/gaia), processed by the Gaia Data Processing and Analysis Consortium (DPAC, www.cosmos.esa.int/web/gaia/dpac/consortium). Funding for the DPAC has been provided by national institutions, in particular the institutions participating in the Gaia Multilateral Agreement. This work was partially supported by the Spanish Ministry of Science, Innovation and University (MICIU/FEDER, UE) through grant RTI2018-095076-B-C21, and the Institute of Cosmos Sciences University of Barcelona (ICCUB, Unidad de Excelencia “María de Maeztu”) through grant CEX2019-000918-M. FA is grateful for funding from the European Union’s Horizon 2020 research and innovation programme under the Marie Skłodowska-Curie grant agreement No. 800502. The preparation of this work has made use of TOPCAT (Taylor 2005), NASA’s Astrophysics Data System Bibliographic Services, as well as the open-source Python packages Astropy (Astropy Collaboration 2018), NumPy (van der Walt et al. 2011), scikit-learn (Virtanen et al. 2020), and emcee (Foreman-Mackey et al. 2013). The figures in this Letter were produced with Matplotlib (Hunter 2007).
References
- Adamo, A., Zeidler, P., Kruijssen, J. M. D., et al. 2020, Space Sci. Rev., 216, 69 [CrossRef] [Google Scholar]
- Astropy Collaboration (Price-Whelan, A. M., et al.) 2018, AJ, 156, 123 [Google Scholar]
- Battinelli, P., & Capuzzo-Dolcetta, R. 1991, MNRAS, 249, 76 [NASA ADS] [Google Scholar]
- Becker, W. 1963, Z. Astrophys., 57, 117 [Google Scholar]
- Becker, W., & Fenkart, R. B. 1970, in The Spiral Structure of Our Galaxy, eds. W. Becker, & G. I. Kontopoulos, IAU Symp., 38, 205 [CrossRef] [Google Scholar]
- Bossini, D., Vallenari, A., Bragaglia, A., et al. 2019, A&A, 623, A108 [NASA ADS] [CrossRef] [EDP Sciences] [Google Scholar]
- Cantat-Gaudin, T., & Anders, F. 2020, A&A, 633, A99 [NASA ADS] [CrossRef] [EDP Sciences] [Google Scholar]
- Cantat-Gaudin, T., Jordi, C., Vallenari, A., et al. 2018, A&A, 618, A93 [NASA ADS] [CrossRef] [EDP Sciences] [Google Scholar]
- Cantat-Gaudin, T., Krone-Martins, A., Sedaghat, N., et al. 2019, A&A, 624, A126 [NASA ADS] [CrossRef] [EDP Sciences] [Google Scholar]
- Cantat-Gaudin, T., Anders, F., Castro-Ginard, A., et al. 2020, A&A, 640, A1 [NASA ADS] [CrossRef] [EDP Sciences] [Google Scholar]
- Castro-Ginard, A., Jordi, C., Luri, X., Cantat-Gaudin, T., & Balaguer-Núñez, L. 2019, A&A, 627, A35 [NASA ADS] [CrossRef] [EDP Sciences] [Google Scholar]
- Castro-Ginard, A., Jordi, C., Luri, X., et al. 2020, A&A, 635, A45 [NASA ADS] [CrossRef] [EDP Sciences] [Google Scholar]
- Dreyer, J. L. E. 1888, Mem. R. Astron. Soc., 49, 1 [NASA ADS] [CrossRef] [Google Scholar]
- Efremov, Y. N. 2010, MNRAS, 405, 1531 [NASA ADS] [Google Scholar]
- Evans, D. W., Riello, M., De Angeli, F., et al. 2018, A&A, 616, A4 [NASA ADS] [CrossRef] [EDP Sciences] [Google Scholar]
- Foreman-Mackey, D., Hogg, D. W., Lang, D., & Goodman, J. 2013, PASP, 125, 306 [Google Scholar]
- Froebrich, D., Scholz, A., & Raftery, C. L. 2007, MNRAS, 374, 399 [Google Scholar]
- Gaia Collaboration (Brown, A. G. A., et al.) 2018, A&A, 616, A1 [NASA ADS] [CrossRef] [EDP Sciences] [Google Scholar]
- Gieles, M., Lamers, H. J. G. L. M., & Portegies Zwart, S. F. 2007, ApJ, 668, 268 [NASA ADS] [CrossRef] [Google Scholar]
- Hunter, J. D. 2007, Comput. Sci. Eng., 9, 90 [NASA ADS] [CrossRef] [Google Scholar]
- Janes, K. A., Tilley, C., & Lynga, G. 1988, AJ, 95, 771 [NASA ADS] [CrossRef] [Google Scholar]
- Joshi, Y. C., Dambis, A. K., Pandey, A. K., & Joshi, S. 2016, A&A, 593, A116 [NASA ADS] [CrossRef] [EDP Sciences] [Google Scholar]
- Kharchenko, N. V., Piskunov, A. E., Schilbach, E., Röser, S., & Scholz, R. D. 2013, A&A, 558, A53 [NASA ADS] [CrossRef] [EDP Sciences] [Google Scholar]
- Kharchenko, N. V., Piskunov, A. E., Schilbach, E., Röser, S., & Scholz, R. D. 2016, A&A, 585, A101 [NASA ADS] [CrossRef] [EDP Sciences] [Google Scholar]
- Kounkel, M., & Covey, K. 2019, AJ, 158, 122 [Google Scholar]
- Kounkel, M., Covey, K., & Stassun, K. G. 2020, AJ, 160, 279 [Google Scholar]
- Krumholz, M. R., McKee, C. F., & Bland-Hawthorn, J. 2019, ARA&A, 57, 227 [NASA ADS] [CrossRef] [Google Scholar]
- Lamers, H. J. G. L. M., & Gieles, M. 2006, A&A, 455, L17 [NASA ADS] [CrossRef] [EDP Sciences] [Google Scholar]
- Lamers, H. J. G. L. M., Gieles, M., Bastian, N., et al. 2005, A&A, 441, 117 [NASA ADS] [CrossRef] [EDP Sciences] [Google Scholar]
- Liu, L., & Pang, X. 2019, ApJS, 245, 32 [NASA ADS] [CrossRef] [Google Scholar]
- Meingast, S., Alves, J., & Fürnkranz, V. 2019, A&A, 622, L13 [NASA ADS] [CrossRef] [EDP Sciences] [Google Scholar]
- Moitinho, A. 2010, in Star Clusters: Basic Galactic Building Blocks Throughout Time and Space, eds. R. de Grijs, & J. R. D. Lépine, IAU Symp., 266, 106 [Google Scholar]
- Mor, R., Robin, A. C., Figueras, F., Roca-Fàbrega, S., & Luri, X. 2019, A&A, 624, L1 [NASA ADS] [CrossRef] [EDP Sciences] [Google Scholar]
- Morales, E. F. E., Wyrowski, F., Schuller, F., & Menten, K. M. 2013, A&A, 560, A76 [NASA ADS] [CrossRef] [EDP Sciences] [Google Scholar]
- Pandey, A. K., & Mahra, H. S. 1986, Ap&SS, 126, 167 [NASA ADS] [CrossRef] [Google Scholar]
- Piskunov, A. E., Kharchenko, N. V., Röser, S., Schilbach, E., & Scholz, R. D. 2006, A&A, 445, 545 [NASA ADS] [CrossRef] [EDP Sciences] [Google Scholar]
- Piskunov, A. E., Just, A., Kharchenko, N. V., et al. 2018, A&A, 614, A22 [NASA ADS] [CrossRef] [EDP Sciences] [Google Scholar]
- Reid, M. J., Menten, K. M., Brunthaler, A., et al. 2019, ApJ, 885, 131 [NASA ADS] [CrossRef] [Google Scholar]
- Röser, S., & Schilbach, E. 2019, A&A, 627, A4 [NASA ADS] [CrossRef] [EDP Sciences] [Google Scholar]
- Röser, S., Schilbach, E., & Goldman, B. 2019, A&A, 621, L2 [NASA ADS] [CrossRef] [EDP Sciences] [Google Scholar]
- Schuller, F., Menten, K. M., Contreras, Y., et al. 2009, A&A, 504, 415 [NASA ADS] [CrossRef] [EDP Sciences] [Google Scholar]
- Sim, G., Lee, S. H., Ann, H. B., & Kim, S. 2019, J. Korean Astron. Soc., 52, 145 [NASA ADS] [Google Scholar]
- Skowron, D. M., Skowron, J., Mróz, P., et al. 2019, Science, 365, 478 [Google Scholar]
- Taylor, M. B. 2005, in TOPCAT & STIL: Starlink Table/VOTable Processing Software, eds. P. Shopbell, M. Britton, & R. Ebert, ASP Conf. Ser., 347, 29 [Google Scholar]
- van der Walt, S., Colbert, S. C., & Varoquaux, G. 2011, Comput. Sci. Eng., 13, 22 [Google Scholar]
- Virtanen, P., Gommers, R., Oliphant, T. E., et al. 2020, Nat. Meth., 17, 261 [Google Scholar]
- Ward, J. L., Kruijssen, J. M. D., & Rix, H.-W. 2020, MNRAS, 495, 663 [Google Scholar]
- Wielen, R. 1971, A&A, 13, 309 [NASA ADS] [Google Scholar]
Appendix A: Completeness of the OC census
In this appendix, we characterise the completeness of the OC catalogue of Cantat-Gaudin et al. (2020).
The probability of detecting a resolved Galactic star cluster depends on fundamental cluster parameters, such as its total mass, age, distance, or extinction. However, we may also invoke an additional dependence on other, slightly more subtle parameters, such as the contrast in the proper-motion diagram, the number of bright stars, and the amount of differential extinction. We are facing the additional challenge that the true underlying spatial distribution of OCs is complex and unknown, and that the transition between bound clusters, associations, and dissolving structures becomes increasingly unsharp (e.g. Kounkel et al. 2020; Ward et al. 2020).
The Gaia DR2-based catalogue of CGa20 is a clean OC catalogue, limited by the number of stars above a certain magnitude threshold (G < 17…18, depending on the provenance of the cluster detection). In contrast to the case of unresolved extragalactic clusters, the number of stars above the magnitude detection limit only decreases very little with mass as long as the turn-off is above the detection limit (see e.g. Fig. 2 of Gieles et al. 2007). We therefore opt to parametrise the selection function of our OC catalogue as a function depending primarily on Galactic longitude l, latitude b, planar distance dxy, log t, and extinction AV.
We make the following approximation:
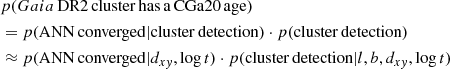
In other words, the completeness of the age census of Gaia DR2 OCs depends on our ability to derive OC parameters for detected clusters and our detection efficiency.
For the first factor (completeness of the ANN-derived parameters), we simply determine the fraction of clusters within dxy = 2 kpc for which no physical parameters were obtained in Cantat-Gaudin et al. (2020, see Fig. A.1). This fraction is very low (≲1%) for log t > 7 and increases to 23% for the youngest age bin (using the age estimates of Kharchenko et al. 2013).
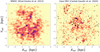 |
Fig. A.1. Distribution of Galactic OCs using the MWSC (left) and the Gaia DR2-derived catalogue (right), respectively. The crosses in the right panel indicate the positions of the clusters for which no physical parameters could be obtained in Cantat-Gaudin et al. (2020). |
To estimate the second factor, we use the experiment carried out by Castro-Ginard et al. (2020). These authors investigated the recovery fraction of their catalogue by comparing the blind-search detections to the OC list of Cantat-Gaudin et al. (2018). They categorised these clusters into recovered, half-recovered, and non-recovered; see Fig. 1 of Castro-Ginard et al. (2020). In this work, we use these weights to determine the OC recovery fraction in wide bins of [l, b, dxy, log t]. We find that the recovery fraction does not depend significantly on extinction (beyond the intrinsic correlation of this parameter with distance). The results are shown in Fig. A.2. Since the blind search of Castro-Ginard et al. (2020) was not optimised for nearby clusters, we focus on the distance range dxy > 1 kpc.
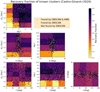 |
Fig. A.2. Cluster recovery fraction of the Galactic plane search of Castro-Ginard et al. (2020), as a function of Galactic longitude, latitude, planar distance, and age. In each panel, the black, grey, and white symbols denote Cantat-Gaudin et al. (2018) clusters that were recovered, half-recovered, or not recovered, respectively, by the blind search of Castro-Ginard et al. (2020). |
Now we can define a completeness fraction as a function of log t out to a limiting distance  by numerically integrating the selection fraction over the dxy, l and b dimensions, and linear interpolation between the log t bins. We also estimate the uncertainty associated with the completeness estimates. To do this, we can assume Poissonian distributions of the counts in each age bin (for each group: non-detected, half-detected, and detected). This allows us to determine the completeness uncertainties numerically.
The implicit assumption behind our approach is that the experiment of Castro-Ginard et al. (2020) is representative for the full CGa20 catalogue. This is debatable, but the best we can do at present. On the one hand, this estimate is pessimistic because we only estimate the completeness of one method (DBSCAN), while the full catalogue of Gaia-detected OCs was compiled from various search methods (e.g. traditional OCs, serendipitous discoveries, and blind machine-learning searches.). It is also pessimistic in the sense that the blind search of Castro-Ginard et al. (2020) has added more than 500 new OCs. On the other hand, we may argue that the DBSCAN completeness test of Castro-Ginard et al. (2020) may have been slightly optimistic since the sample of Cantat-Gaudin et al. (2018) may not be fully representative of the underlying population.
The results of our completeness calculations are given in Table A.1. The second column contains the first factor (physical parameter completeness), the third column contains the second factor (cluster recovery fraction), and the last column the product of the two. The associated systematic uncertainties have been propagated into the uncertainties of the CAF (e.g. the error bars in Fig. 2) and all derived quantities.
Completeness estimates as a function of age for the CGa20 catalogue out to  kpc.
kpc.
All Tables
Completeness estimates as a function of age for the CGa20 catalogue out to kpc.
All Figures
|
Fig. 1. Galactic distribution of the OC samples studied in this Letter, sliced into logarithmic age bins. Left: pre-Gaia census using the MWSC catalogue (Kharchenko et al. 2013). Right: post-Gaia DR2 census, using the catalogue of Cantat-Gaudin et al. (2020). In each panel we show a 2D kernel density estimate with a fixed bandwidth of 0.05 kpc. For the MWSC, the dashed circle corresponds to the completeness limit of 1.8 kpc used in the literature (e.g., Piskunov et al. 2018); for the Gaia DR2 census, a sample limit of 2 kpc is used together with age-dependent completeness fractions indicated in each panel (see Sect. 2, last paragraph). |
| In the text | |
|
Fig. 2. Age distribution for Galactic open clusters in the solar vicinity. Top panel: normalised histograms and kernel-density estimates. The cyan and blue distributions show the results from the MWSC survey (Kharchenko et al. 2013; Piskunov et al. 2018, respectively); the red distribution shows our Gaia DR2-derived results. Middle and bottom panels: observational CAF determinations for the extended solar neighbourhood, from Wielen (1971) to our completeness-corrected Gaia DR2-based census (red). Error bars include Poissonian uncertainties in the number of clusters per bin and systematic uncertainties from the completeness correction (see Appendix A). Bottom panel: CAF comparison to models, as indicated in the legend. |
| In the text | |
|
Fig. A.1. Distribution of Galactic OCs using the MWSC (left) and the Gaia DR2-derived catalogue (right), respectively. The crosses in the right panel indicate the positions of the clusters for which no physical parameters could be obtained in Cantat-Gaudin et al. (2020). |
| In the text | |
|
Fig. A.2. Cluster recovery fraction of the Galactic plane search of Castro-Ginard et al. (2020), as a function of Galactic longitude, latitude, planar distance, and age. In each panel, the black, grey, and white symbols denote Cantat-Gaudin et al. (2018) clusters that were recovered, half-recovered, or not recovered, respectively, by the blind search of Castro-Ginard et al. (2020). |
| In the text | |
Current usage metrics show cumulative count of Article Views (full-text article views including HTML views, PDF and ePub downloads, according to the available data) and Abstracts Views on Vision4Press platform.
Data correspond to usage on the plateform after 2015. The current usage metrics is available 48-96 hours after online publication and is updated daily on week days.
Initial download of the metrics may take a while.