Fig. 2.
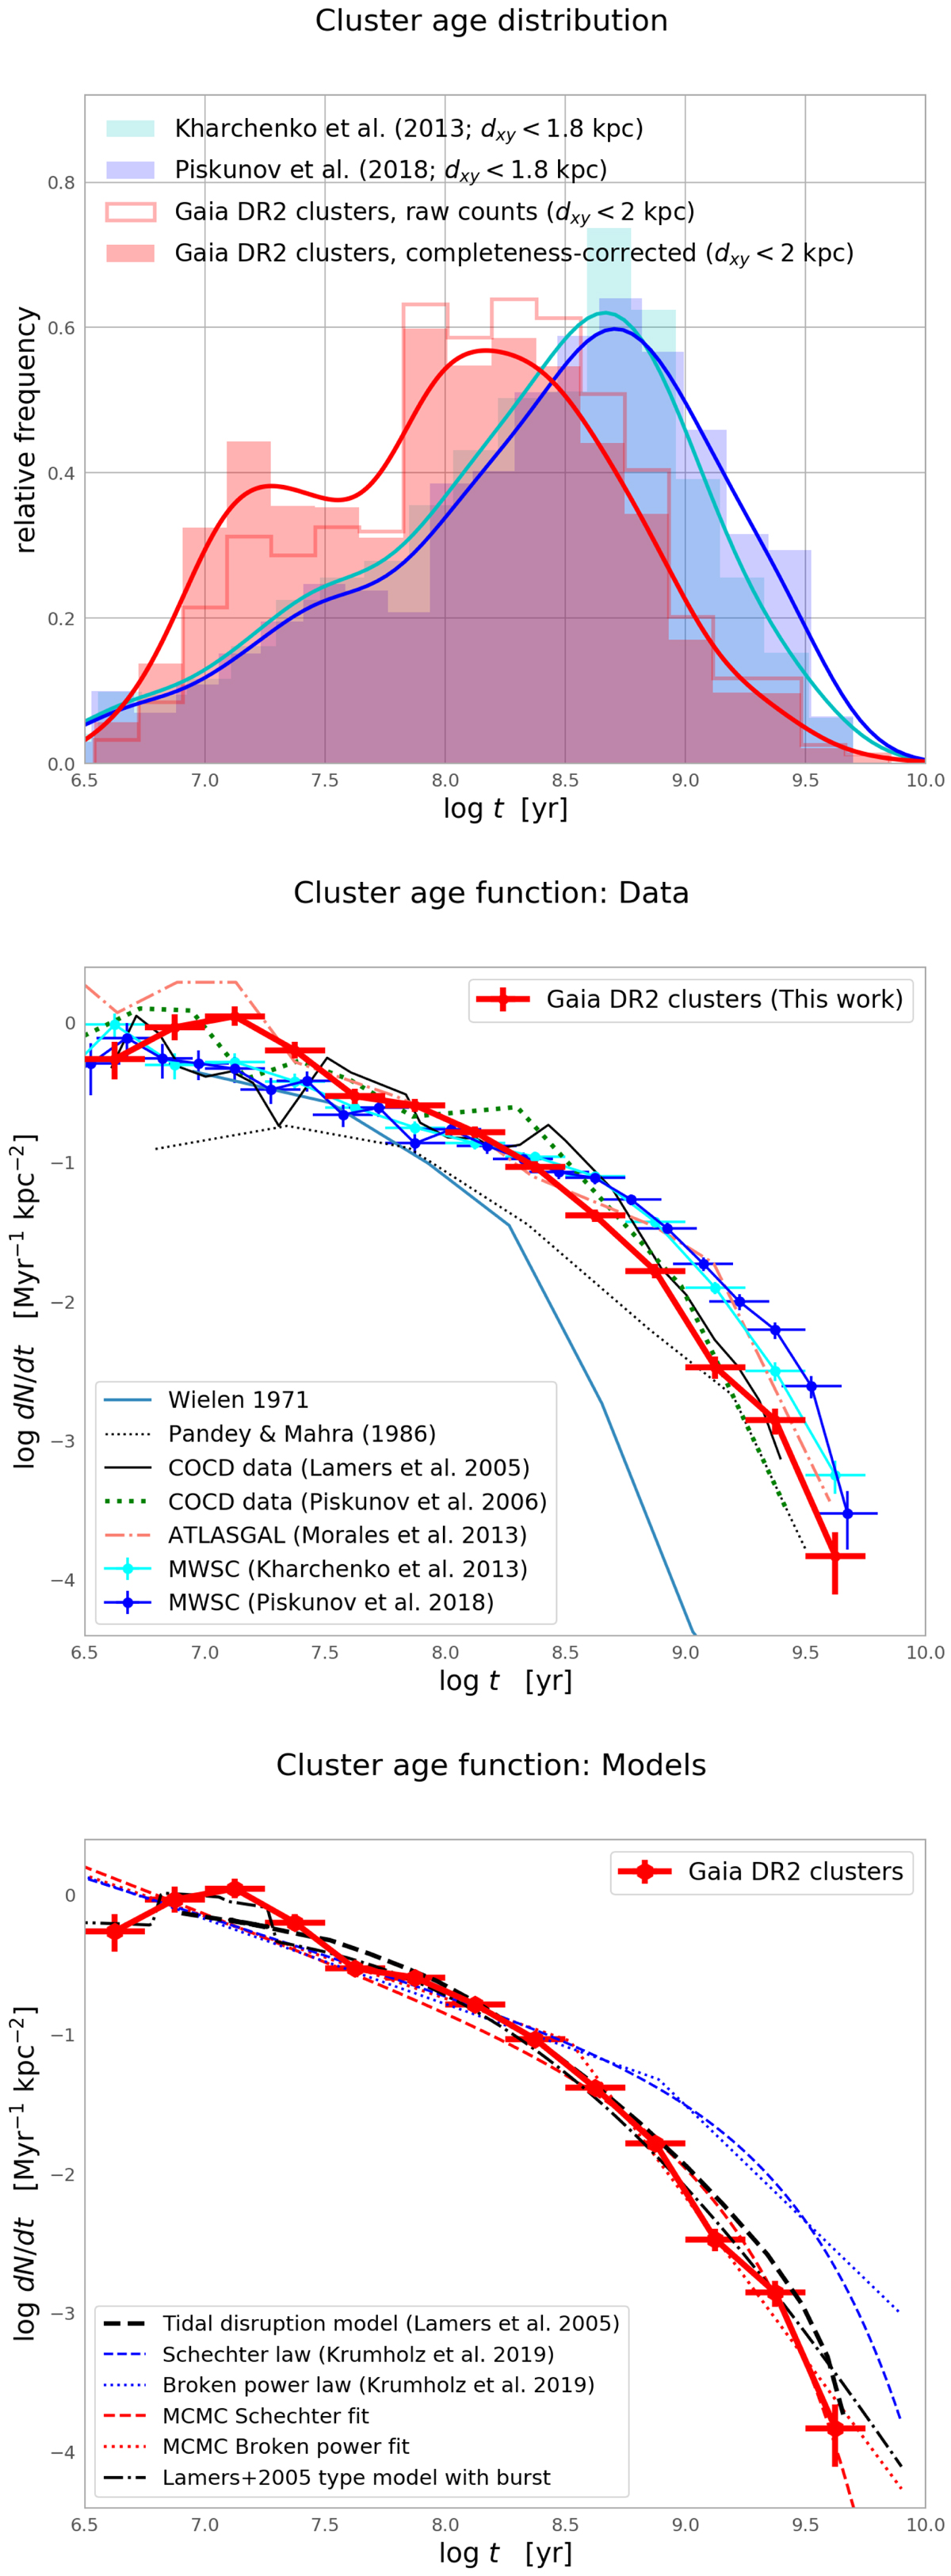
Age distribution for Galactic open clusters in the solar vicinity. Top panel: normalised histograms and kernel-density estimates. The cyan and blue distributions show the results from the MWSC survey (Kharchenko et al. 2013; Piskunov et al. 2018, respectively); the red distribution shows our Gaia DR2-derived results. Middle and bottom panels: observational CAF determinations for the extended solar neighbourhood, from Wielen (1971) to our completeness-corrected Gaia DR2-based census (red). Error bars include Poissonian uncertainties in the number of clusters per bin and systematic uncertainties from the completeness correction (see Appendix A). Bottom panel: CAF comparison to models, as indicated in the legend.
Current usage metrics show cumulative count of Article Views (full-text article views including HTML views, PDF and ePub downloads, according to the available data) and Abstracts Views on Vision4Press platform.
Data correspond to usage on the plateform after 2015. The current usage metrics is available 48-96 hours after online publication and is updated daily on week days.
Initial download of the metrics may take a while.