Fig. 7
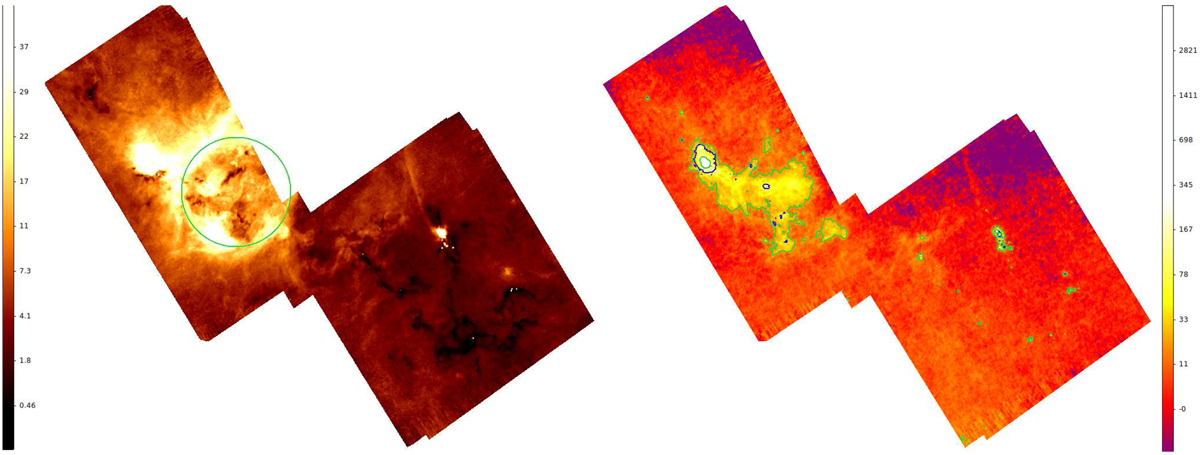
Left panel: inferred 70 μm intensity map extrapolated from the column density and temperature maps obtained for λ ≥ 160 μm. The green circle shows the bubble found by Ridge et al. (2006b) (CPS5 in the list by Arce et al. 2011). Right panel: difference between the observed 70 μm map and the extrapolated map. Green contours are 20 and 200 MJy sr−1; blue contours show the region where TPACSonly ≥ 20 K (see text). Colour bars are in MJy sr−1.
Current usage metrics show cumulative count of Article Views (full-text article views including HTML views, PDF and ePub downloads, according to the available data) and Abstracts Views on Vision4Press platform.
Data correspond to usage on the plateform after 2015. The current usage metrics is available 48-96 hours after online publication and is updated daily on week days.
Initial download of the metrics may take a while.