Fig. 6
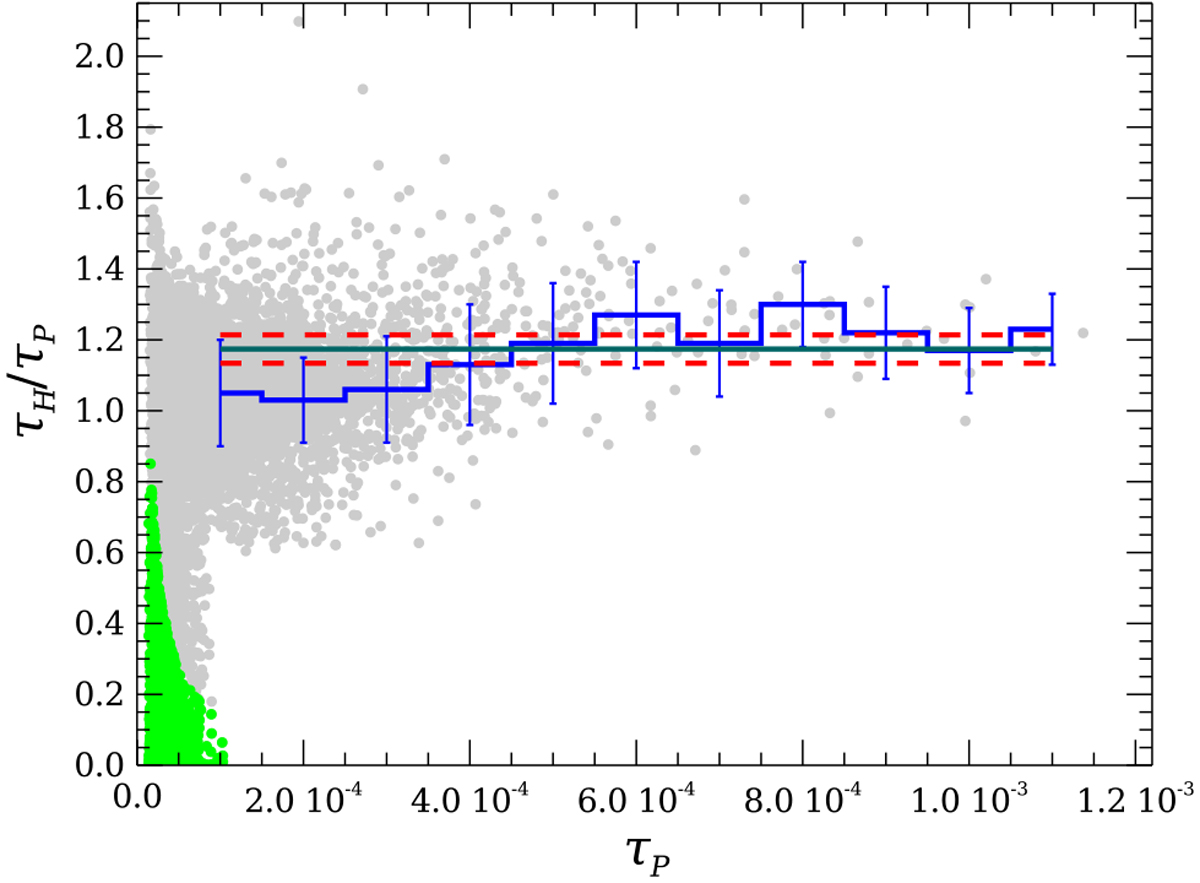
Ratio of τH, the optical depth derived from our Herschel observations, to τP, the opticaldepth derived from Planck observations (Planck Collaboration XI 2014) (grey points), with both τ values computed at 850 μm. The ratio is plotted vs. τP. Green pointscorrespond to low values of τH due to the convolution applied to the Herschel column density map (see text). Mean values ± one standard deviation of the grey points, excluding the green ones, are shown with the blue histogram. The dark green and the two red lines show the weighted mean of the ratio: 1.174 ± 0.040.
Current usage metrics show cumulative count of Article Views (full-text article views including HTML views, PDF and ePub downloads, according to the available data) and Abstracts Views on Vision4Press platform.
Data correspond to usage on the plateform after 2015. The current usage metrics is available 48-96 hours after online publication and is updated daily on week days.
Initial download of the metrics may take a while.