Fig. 4
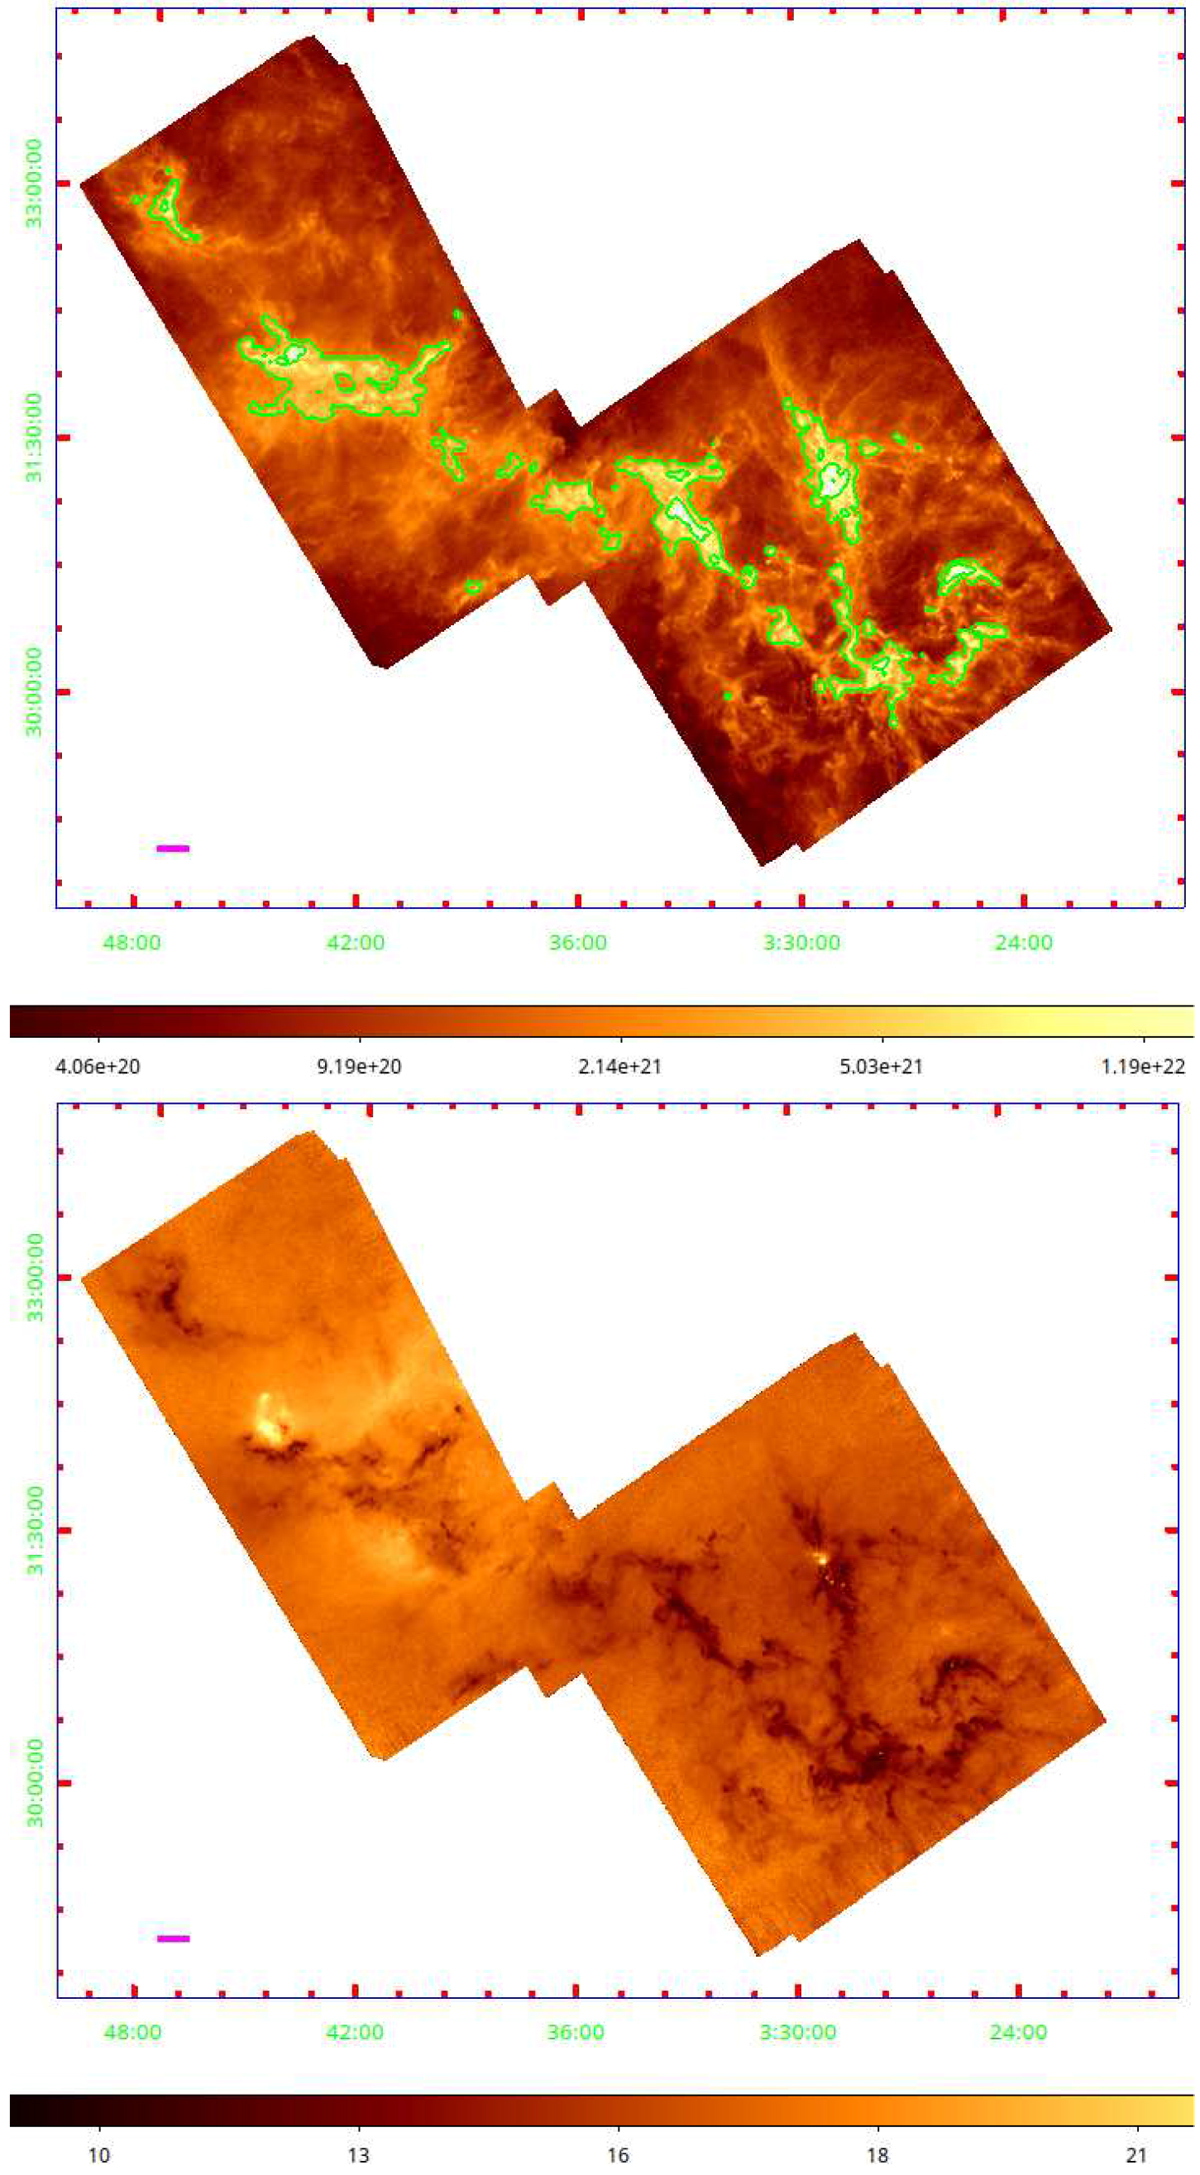
Top panel: column density map with contours at 3 × 1021 cm−2 and 1022 cm−2. Bottom panel: dust temperature map. In both panels, the magenta line in the bottom-left corner shows the angular scale corresponding to 1 pc at 300 pc; J2000.0 coordinates grid is shown. Both maps have a spatial resolution of 36′′. 1. The anticorrelation between N(H2) and Td is evident: regions at high/low column density are cold/warm, with few exceptions in IC348 and NGC 1333.
Current usage metrics show cumulative count of Article Views (full-text article views including HTML views, PDF and ePub downloads, according to the available data) and Abstracts Views on Vision4Press platform.
Data correspond to usage on the plateform after 2015. The current usage metrics is available 48-96 hours after online publication and is updated daily on week days.
Initial download of the metrics may take a while.