Fig. C.2
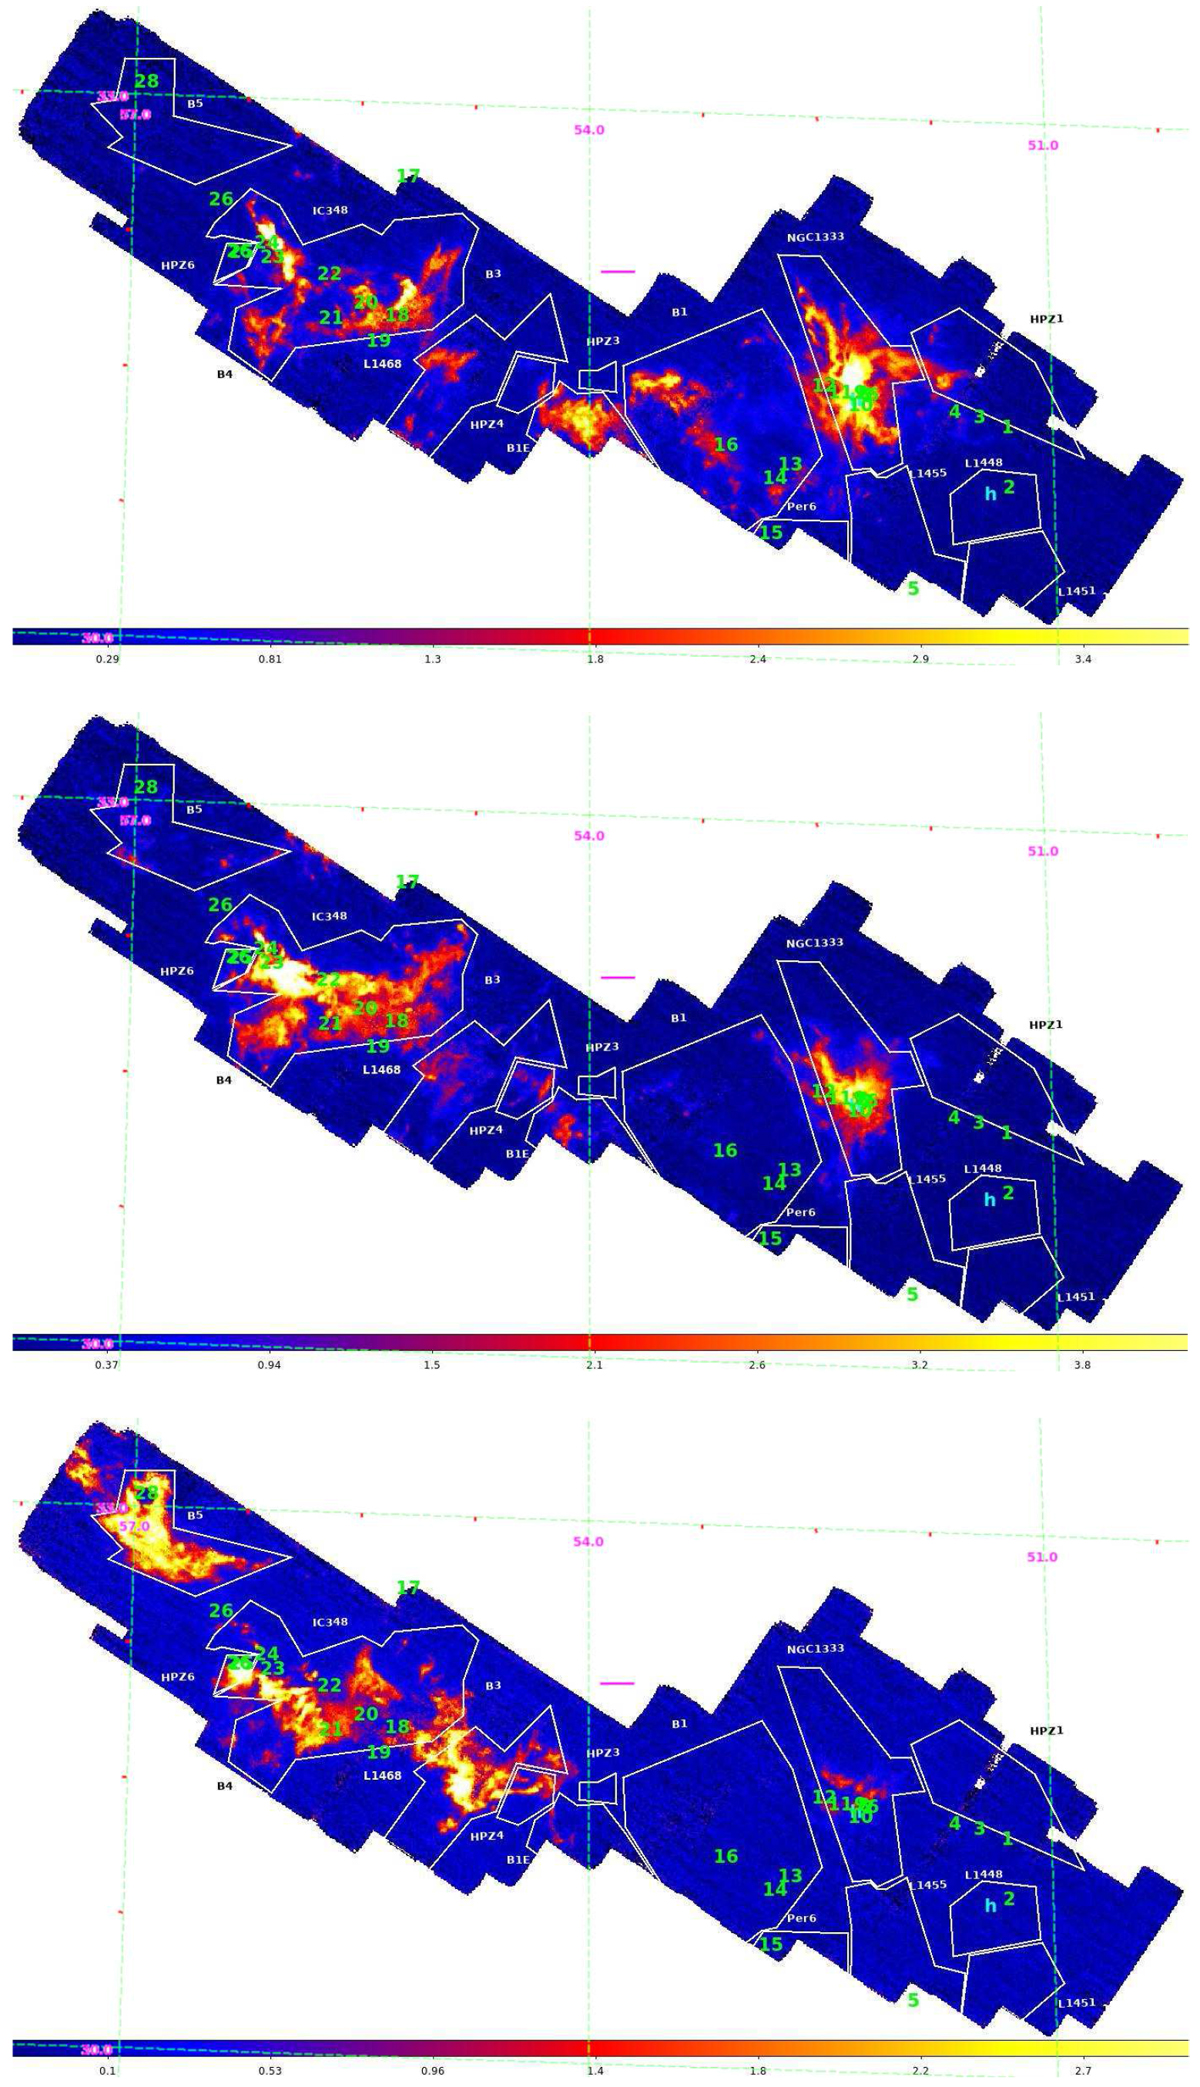
Maps of 13CO in three velocity channels: 7.9 Km s−1 (top), 8.8 Km s−1 (centre), 10.0 Km s−1 (bottom). In the latter panel, north of B5 and slightly covered by label 28, the bubble CPS12 (Arce et al. 2011) is evident. The magenta lines at the centre of each map show the angular scale corresponding to 1 pc at 300 pc; J2000.0 coordinates grid is shown. Labels as in Fig. C.1.
Current usage metrics show cumulative count of Article Views (full-text article views including HTML views, PDF and ePub downloads, according to the available data) and Abstracts Views on Vision4Press platform.
Data correspond to usage on the plateform after 2015. The current usage metrics is available 48-96 hours after online publication and is updated daily on week days.
Initial download of the metrics may take a while.