Fig. B.1
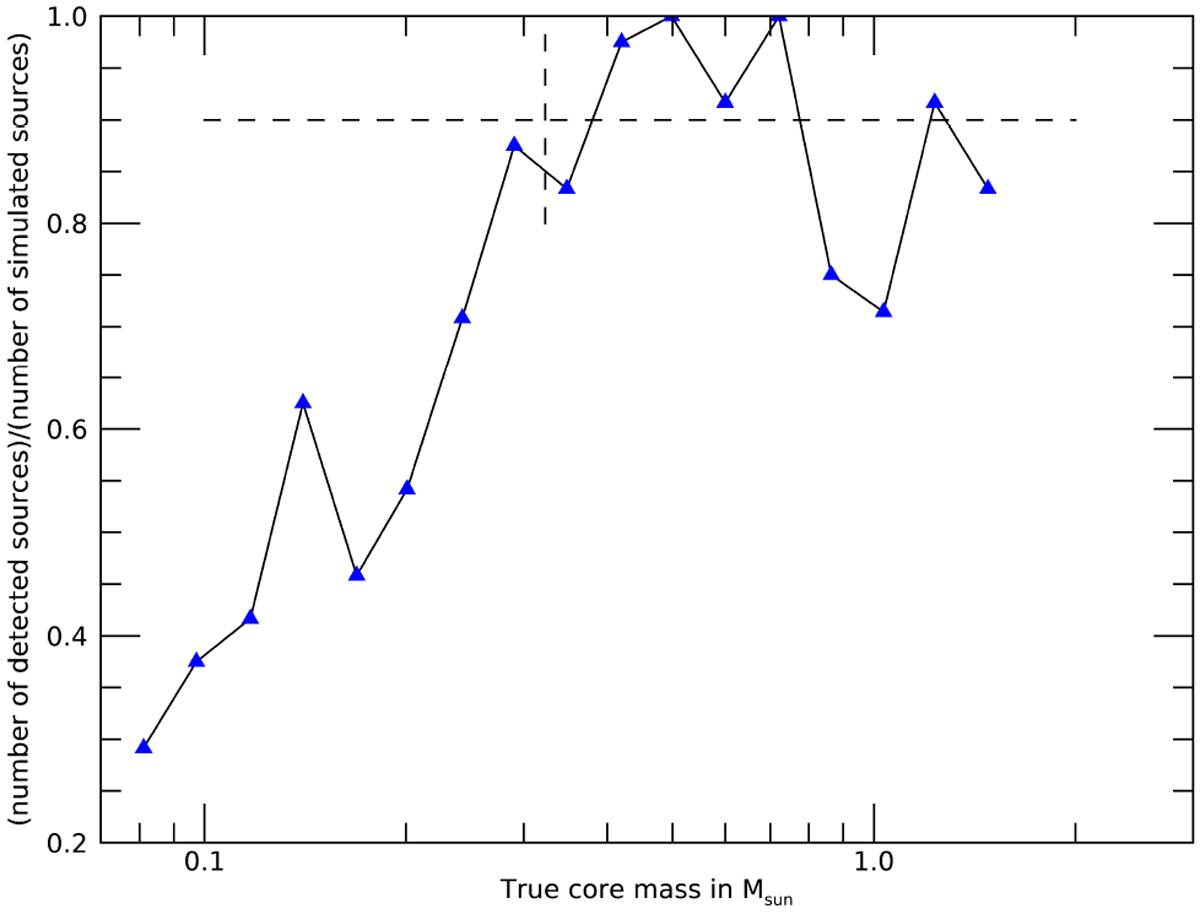
Number of detected sources over number of simulated sources vs. true core mass. The completeness limit is defined as the mass at which completeness is 90%: in our case this happens at 0.323 M⊙, the limit shown as intersection between the two dashed lines. The decrease in the number of detected sources at high mass is discussed in the text (see also next figure).
Current usage metrics show cumulative count of Article Views (full-text article views including HTML views, PDF and ePub downloads, according to the available data) and Abstracts Views on Vision4Press platform.
Data correspond to usage on the plateform after 2015. The current usage metrics is available 48-96 hours after online publication and is updated daily on week days.
Initial download of the metrics may take a while.