Fig. 3
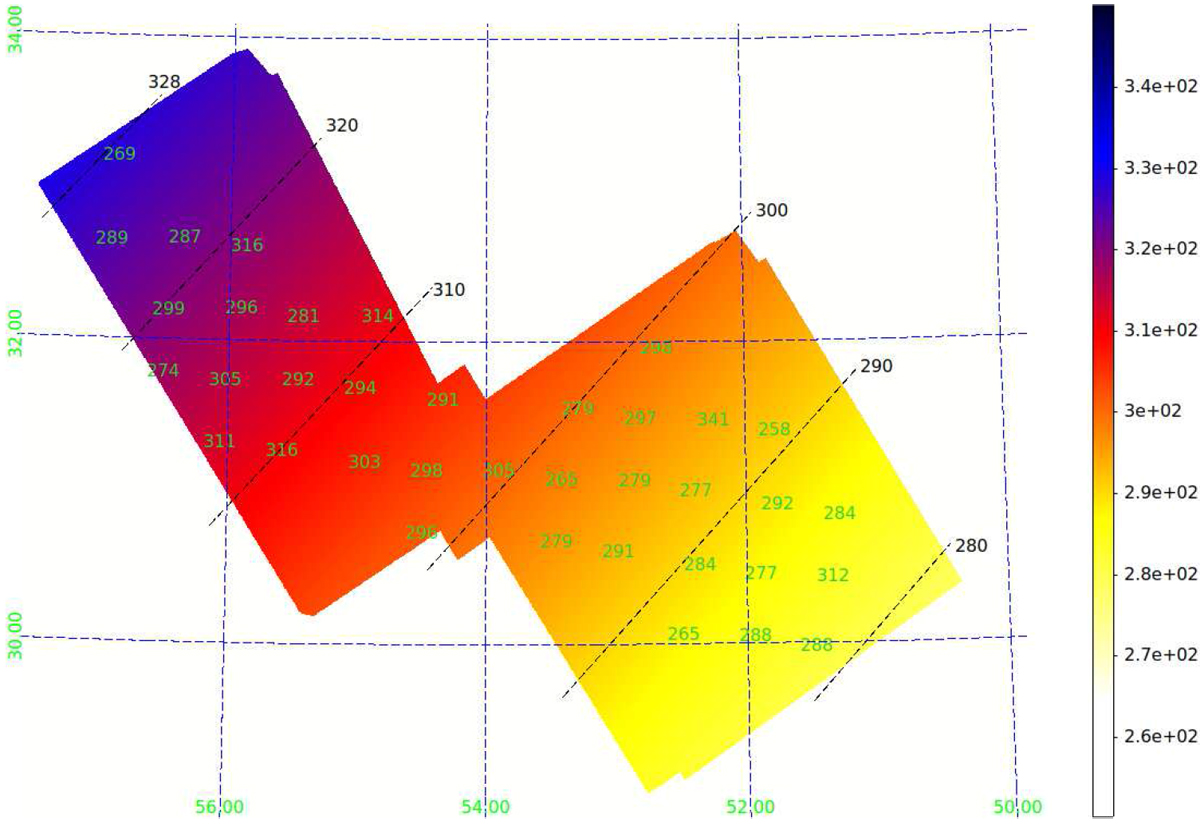
Color-coded 2D visualisation of Eq. (1). Color bar is in parsec, coordinates grid in degrees. Black dashed lines connect points at the same distance, shown in the labels. The coordinates grid, in blue, is in steps of 2°. Green labels are the distances derived by Zucker et al. (2019) in boxes of 0.84![]() , the labels are at the centre of the boxes.
, the labels are at the centre of the boxes.
Current usage metrics show cumulative count of Article Views (full-text article views including HTML views, PDF and ePub downloads, according to the available data) and Abstracts Views on Vision4Press platform.
Data correspond to usage on the plateform after 2015. The current usage metrics is available 48-96 hours after online publication and is updated daily on week days.
Initial download of the metrics may take a while.