Fig. 23
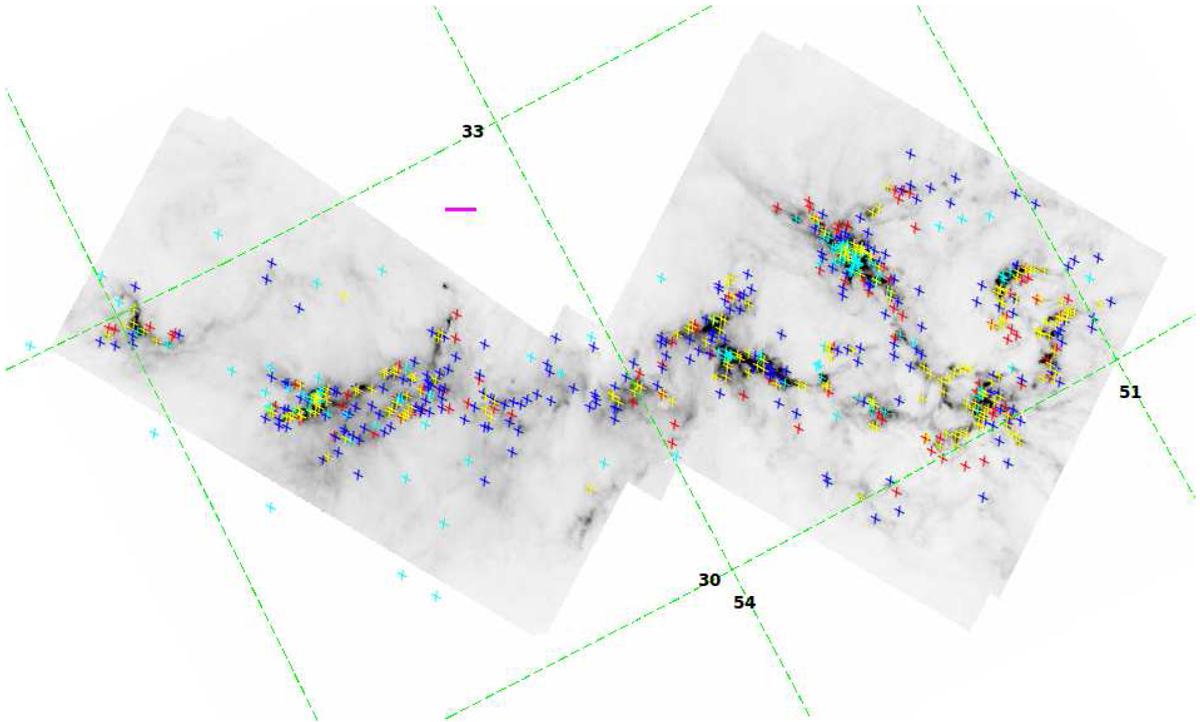
Column density map overlaid with the positions of the 299 prestellar cores (yellow crosses and red crosses are robust and tentative cores, respectively), 220 unbound cores (blue hashes), and 132 protostars (cyan asterisks; we note that these sources were detected on the 70 μm map, which does not overlap completely with the SPIRE field of view, and so five cores are found outside the column density map). The map is rotated by 28°, with the top and bottom corners cut out. The magenta line in the centre shows the angular scale corresponding to 1 pc at 300 pc; J2000.0 coordinates grid is shown.
Current usage metrics show cumulative count of Article Views (full-text article views including HTML views, PDF and ePub downloads, according to the available data) and Abstracts Views on Vision4Press platform.
Data correspond to usage on the plateform after 2015. The current usage metrics is available 48-96 hours after online publication and is updated daily on week days.
Initial download of the metrics may take a while.