Fig. 21
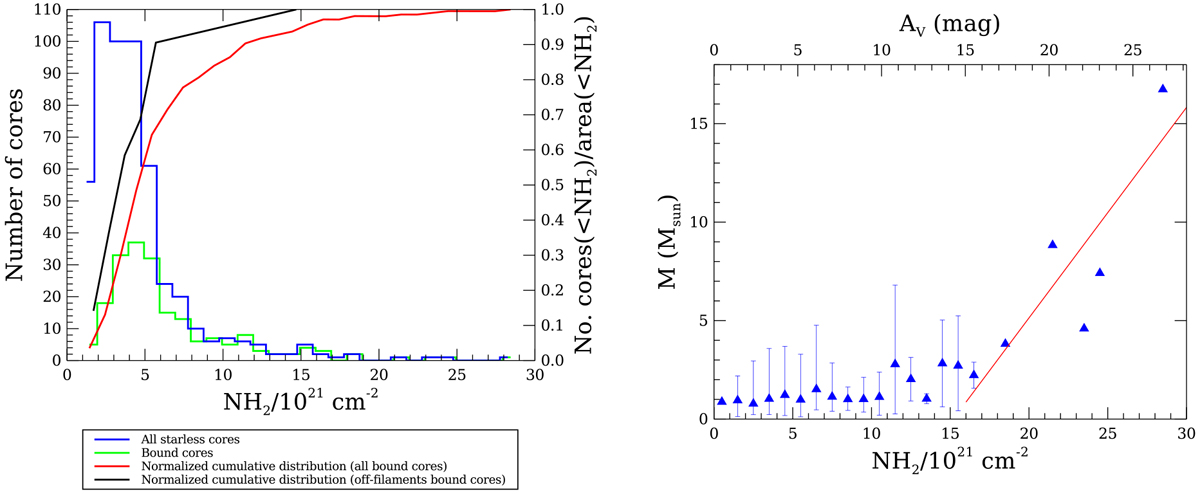
Left panel: comparison of robust bound cores and starless cores. Histograms with the y-axis on the left show the distributions of all starless cores (blue) and all bound cores (green). The red and black lines (right y-axis) show cumulative surface density distributions for all bound cores and the off-filament bound cores, respectively. These distributions were derived by dividing the number of cores found at a certain N(H2) level by the total area in the image where the density is below that value. Right panel: prestellar core mass vs. background N(H2). Triangles are the mean mass averaged over bins of 1021 cm−2. The linear fit is shown as a red line.
Current usage metrics show cumulative count of Article Views (full-text article views including HTML views, PDF and ePub downloads, according to the available data) and Abstracts Views on Vision4Press platform.
Data correspond to usage on the plateform after 2015. The current usage metrics is available 48-96 hours after online publication and is updated daily on week days.
Initial download of the metrics may take a while.