Fig. 19
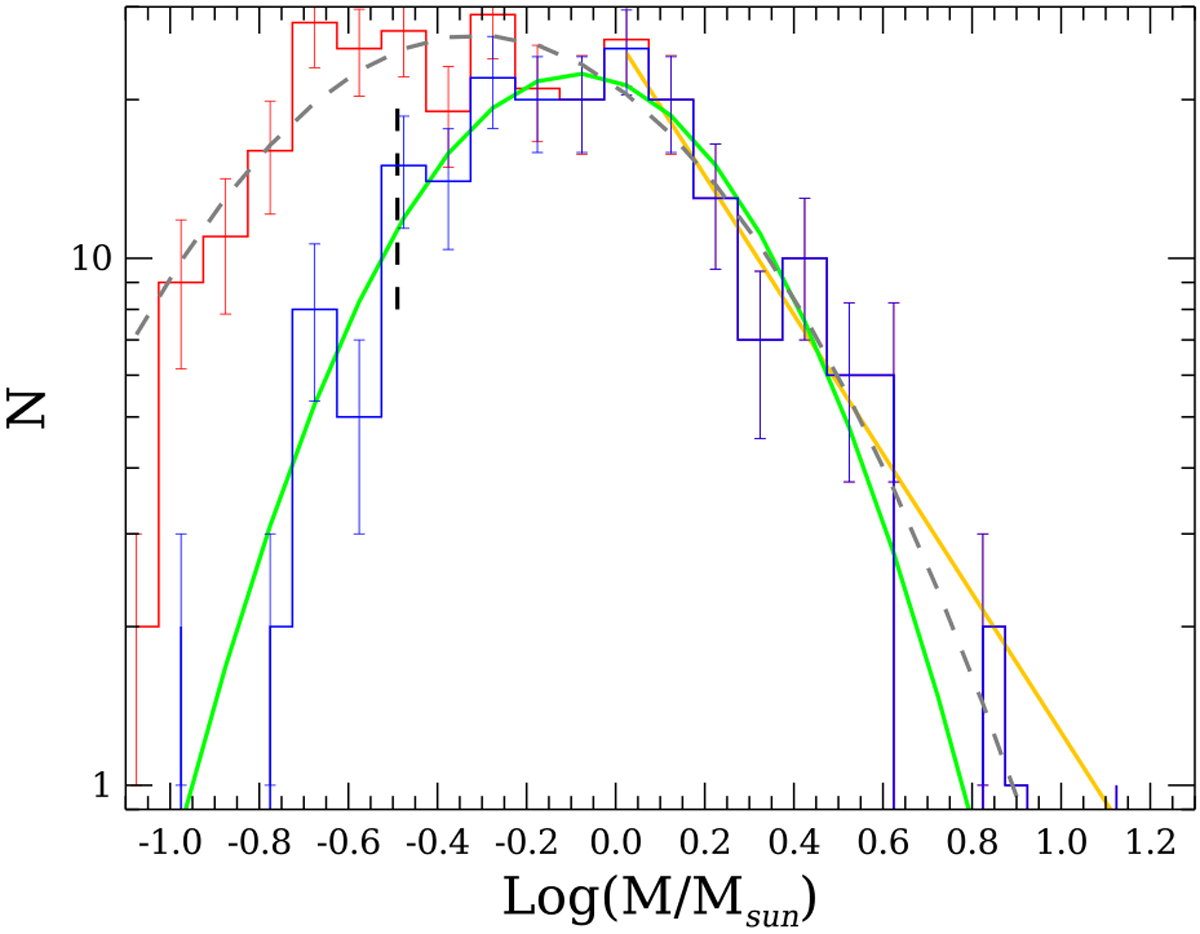
Core mass function (dN/d logM) for the 199 robust prestellar cores (blue histogram), and for the 299 robust and candidateprestellar cores (red histogram) in Perseus. The two distributions overlap above M ~ 1.2. Histogramsuse a bin size of logM = 0.1. Green and dashed grey lines show a log normal fit, and the orange line shows a power-lawfit (see text for details). The dashed black line shows the completeness limit at ~ 0.32 M⊙.
Current usage metrics show cumulative count of Article Views (full-text article views including HTML views, PDF and ePub downloads, according to the available data) and Abstracts Views on Vision4Press platform.
Data correspond to usage on the plateform after 2015. The current usage metrics is available 48-96 hours after online publication and is updated daily on week days.
Initial download of the metrics may take a while.