Fig. 16
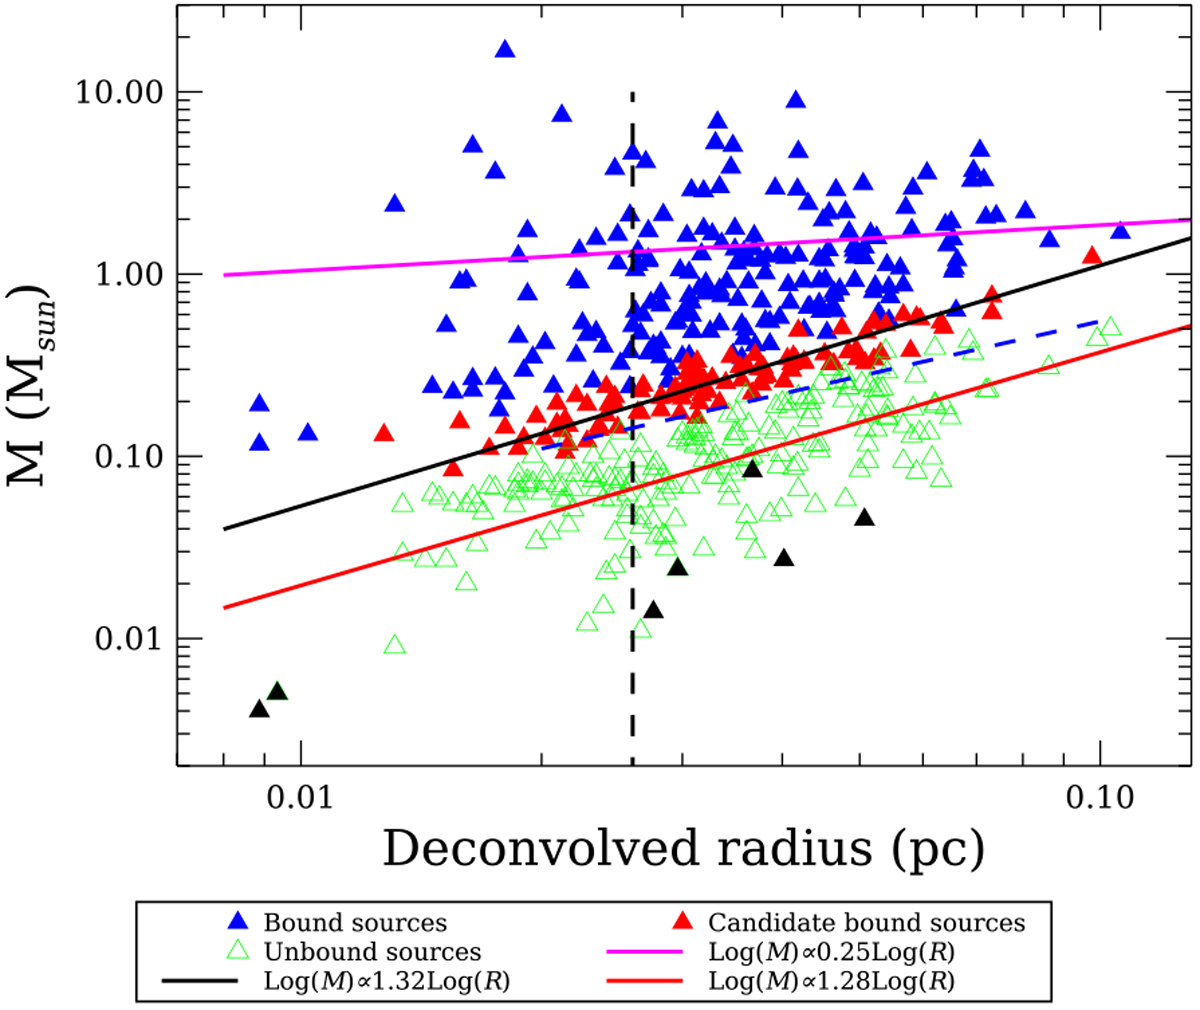
Relation between mass and radius for all the 519 detected cores: vertical dashed line corresponds to 0.026 pc, the linear distance corresponding to the FWHM (18′′. 2) of the high-resolution column density map at 300 pc. The three power laws are fit to our data. Black triangles are hot starless cores discussed in the text; also the blue dashed line is discussed in the text.
Current usage metrics show cumulative count of Article Views (full-text article views including HTML views, PDF and ePub downloads, according to the available data) and Abstracts Views on Vision4Press platform.
Data correspond to usage on the plateform after 2015. The current usage metrics is available 48-96 hours after online publication and is updated daily on week days.
Initial download of the metrics may take a while.