Fig. 15
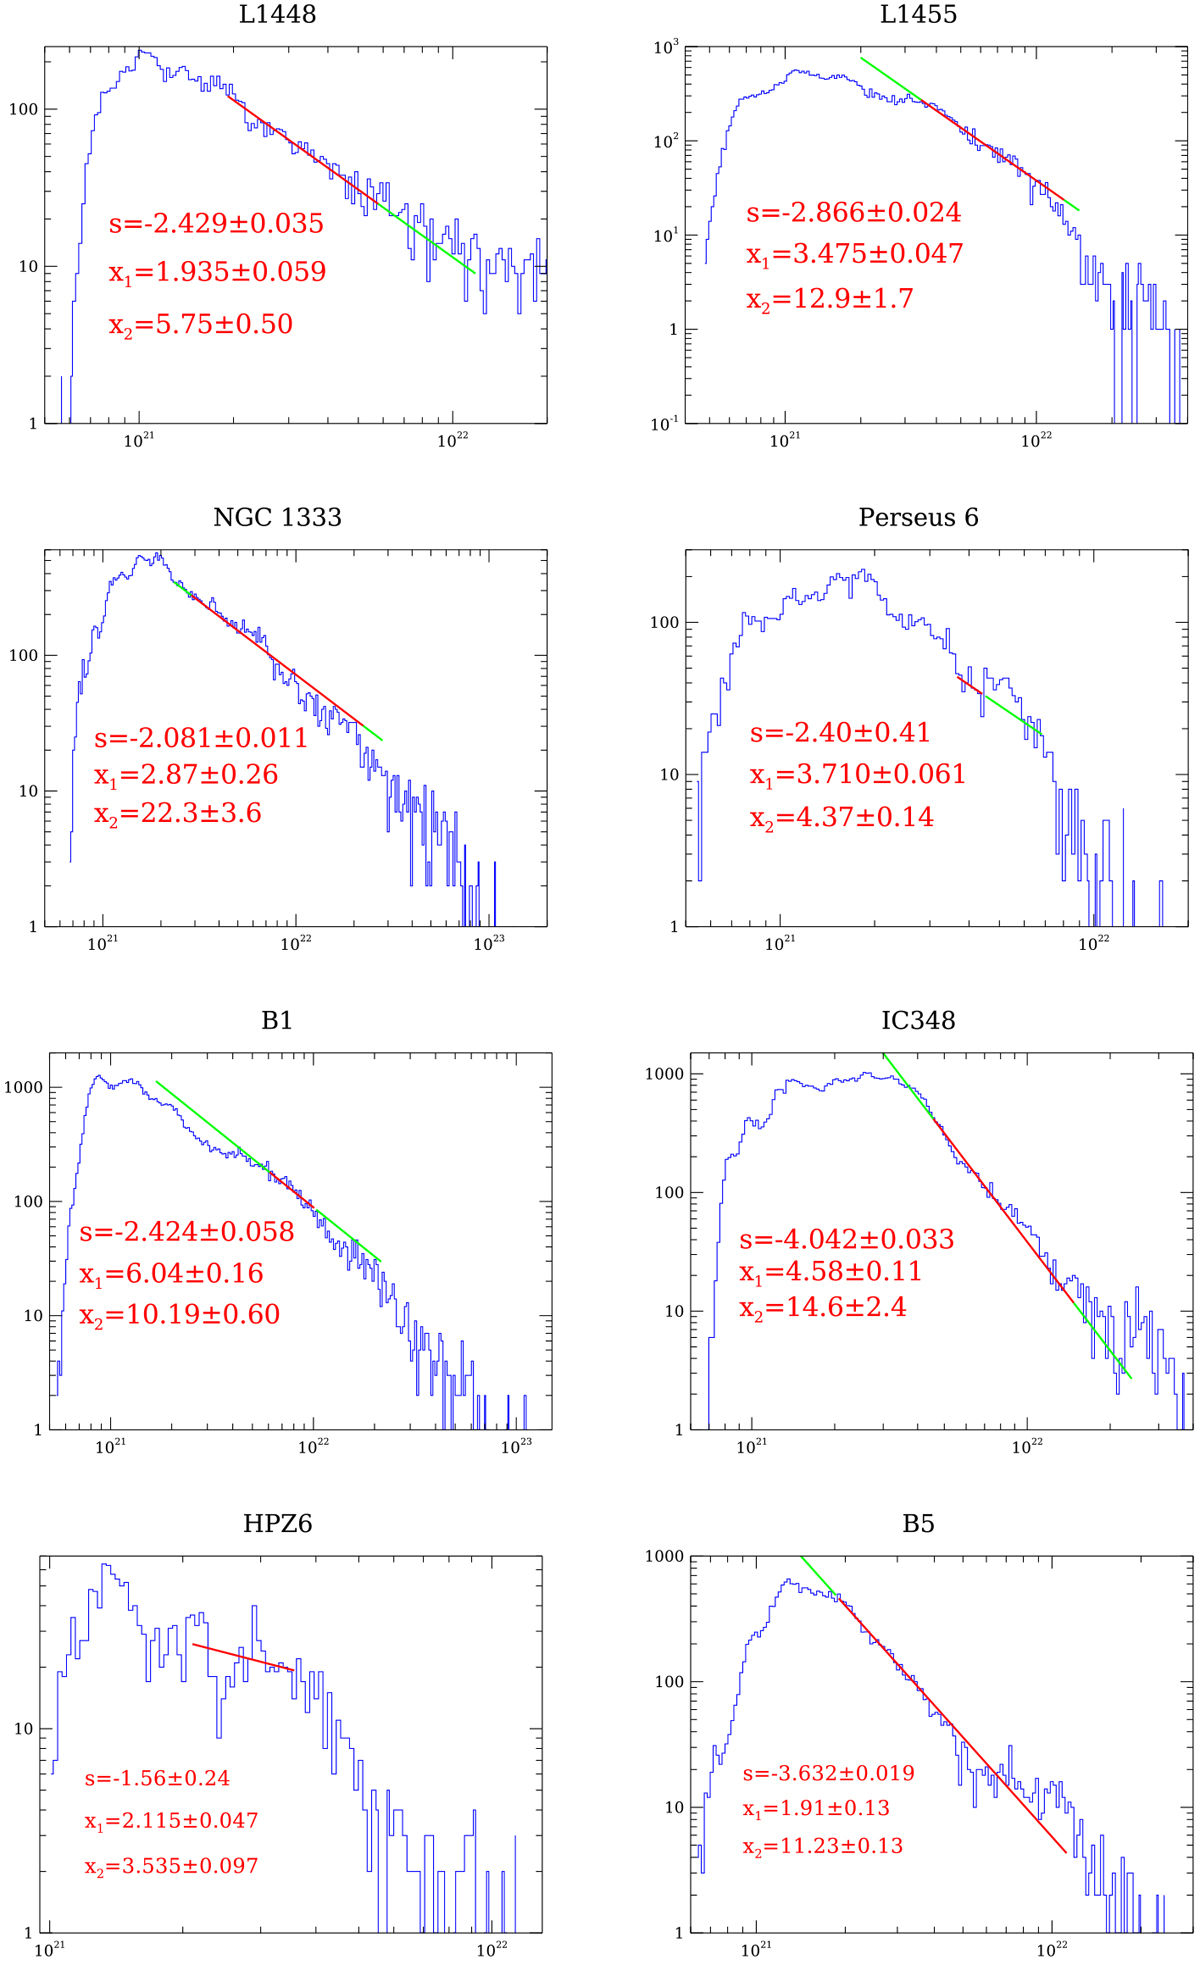
Probability density functions for the subregions identified in Perseus where protostars were detected. In each panel, s gives the slope of the power-law fit, shown in red, in the interval delimited by x1 and x2, both in 1021 cm−2; the fitting procedure is detailed in the text. The x-axis is N(H2) in cm−2. Green lines extend the best fit over the interval of column densities where protostars were found (see Col. N(H2) in Table 9).
Current usage metrics show cumulative count of Article Views (full-text article views including HTML views, PDF and ePub downloads, according to the available data) and Abstracts Views on Vision4Press platform.
Data correspond to usage on the plateform after 2015. The current usage metrics is available 48-96 hours after online publication and is updated daily on week days.
Initial download of the metrics may take a while.