Fig. 14
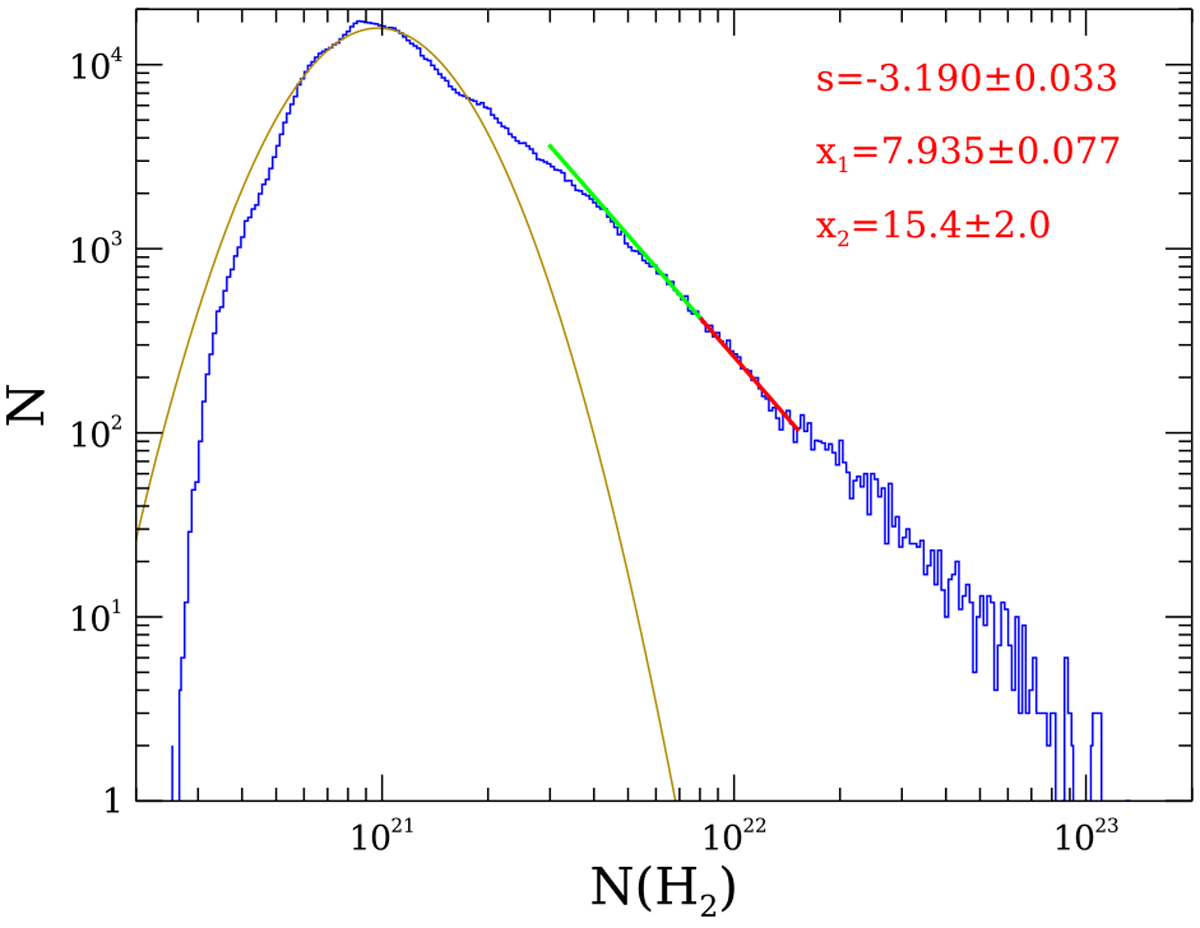
Column density PDF for the whole Perseus molecular cloud: s is the slope of the power-law fit, shown in red, over the interval x1–x2, both in 1021 cm−2. As shown with the green line, the fit can be extended down to ~4 × 1021 cm−2. The brownline is a log-normal fit to the low-density PDF whose parameters are given in the text. Note that N(H2) ~ 1.6 × 1021 cm−2 is the smallest column density having a closed contour in our map.
Current usage metrics show cumulative count of Article Views (full-text article views including HTML views, PDF and ePub downloads, according to the available data) and Abstracts Views on Vision4Press platform.
Data correspond to usage on the plateform after 2015. The current usage metrics is available 48-96 hours after online publication and is updated daily on week days.
Initial download of the metrics may take a while.