Fig. 10
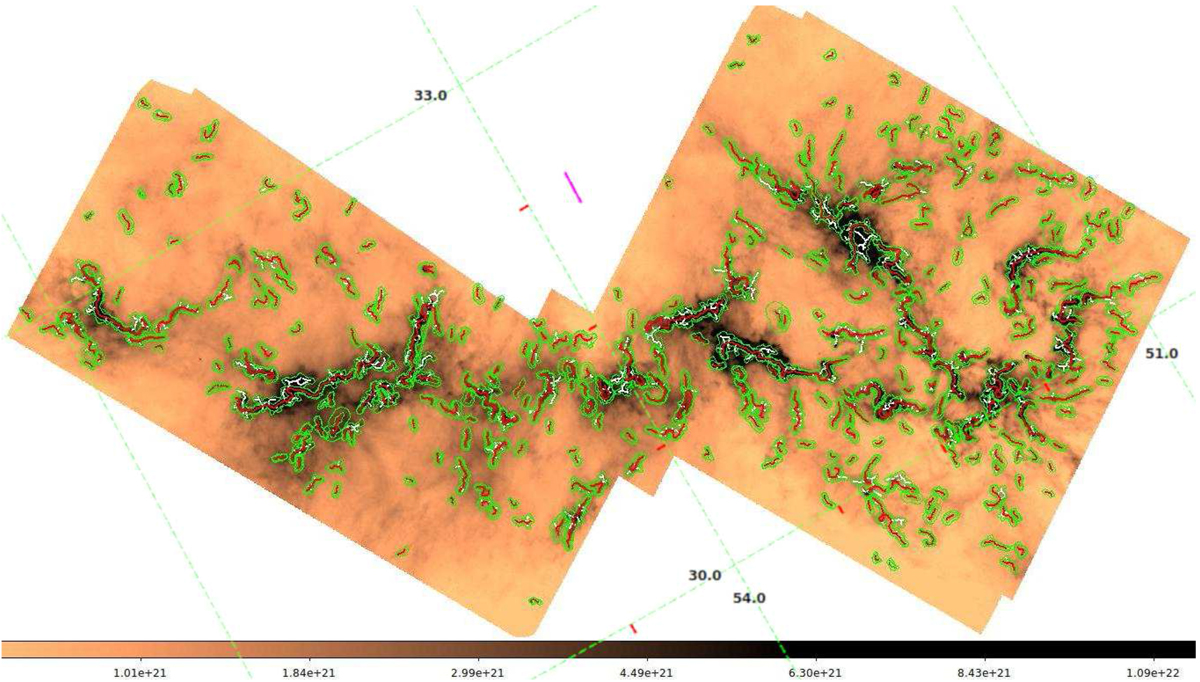
Network of filaments overplotted on the column density map. Red lines show the spine of the filaments, white lines show the branches, and the green contours show the width of the filaments and branches. The map has been rotated by 28°. The magenta line in the centre shows the angular scale corresponding to 1 pc at 300 pc. The J2000.0 coordinates grid is shown.
Current usage metrics show cumulative count of Article Views (full-text article views including HTML views, PDF and ePub downloads, according to the available data) and Abstracts Views on Vision4Press platform.
Data correspond to usage on the plateform after 2015. The current usage metrics is available 48-96 hours after online publication and is updated daily on week days.
Initial download of the metrics may take a while.