Fig. 1
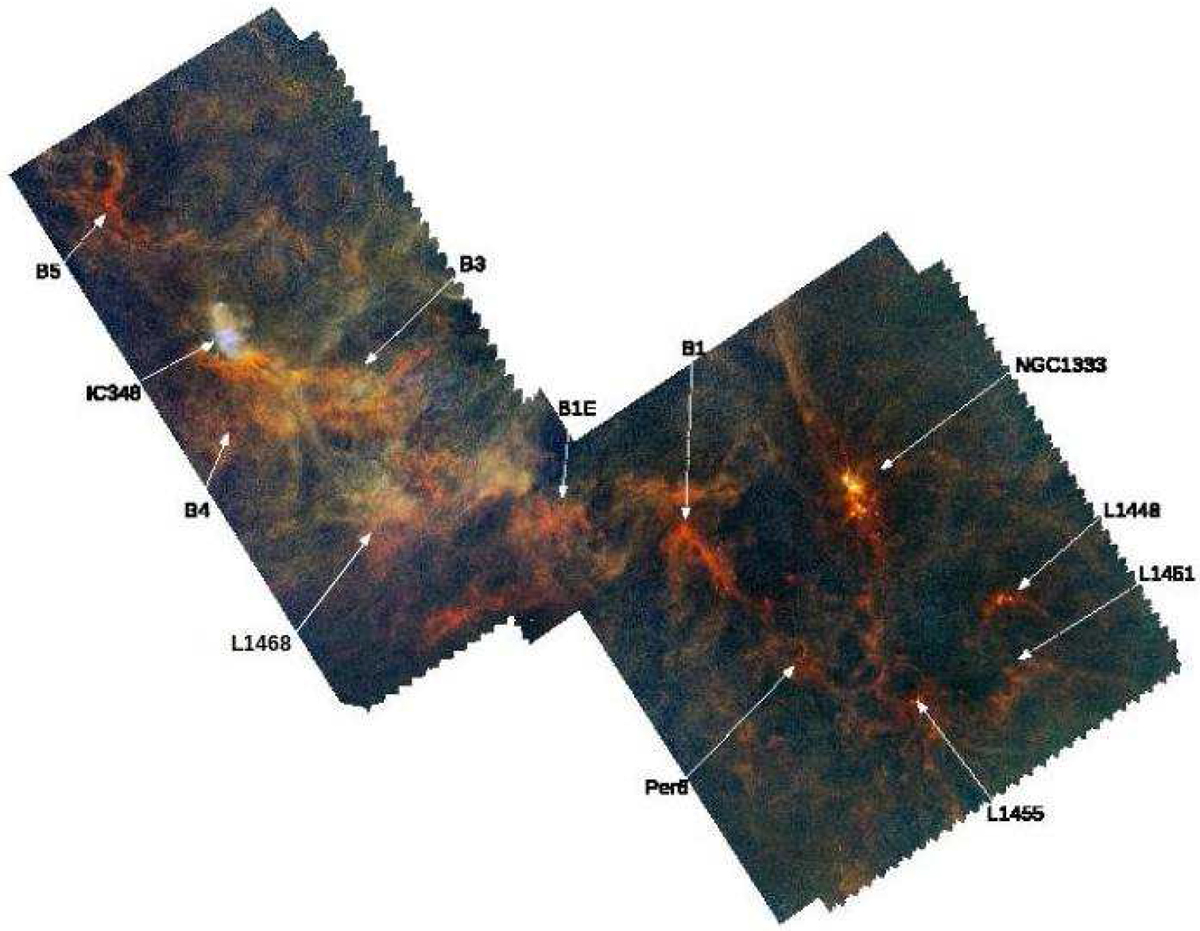
Composite image of the star-forming region in Perseus. Blue is PACS 70 μm; green is PACS 160 μm; red is SPIRE250 μm; north is up, east is to the left. The latter two maps have been processed to simulate having the highest resolution of the 70 μm. The resulting image is therefore not meant to be used for scientific analysis. Labels on the map identify the approximate position of main subregions. Monochromatic Herschel intensity maps are reproduced in Appendix D with coordinate grids.
Current usage metrics show cumulative count of Article Views (full-text article views including HTML views, PDF and ePub downloads, according to the available data) and Abstracts Views on Vision4Press platform.
Data correspond to usage on the plateform after 2015. The current usage metrics is available 48-96 hours after online publication and is updated daily on week days.
Initial download of the metrics may take a while.