Fig. B.3
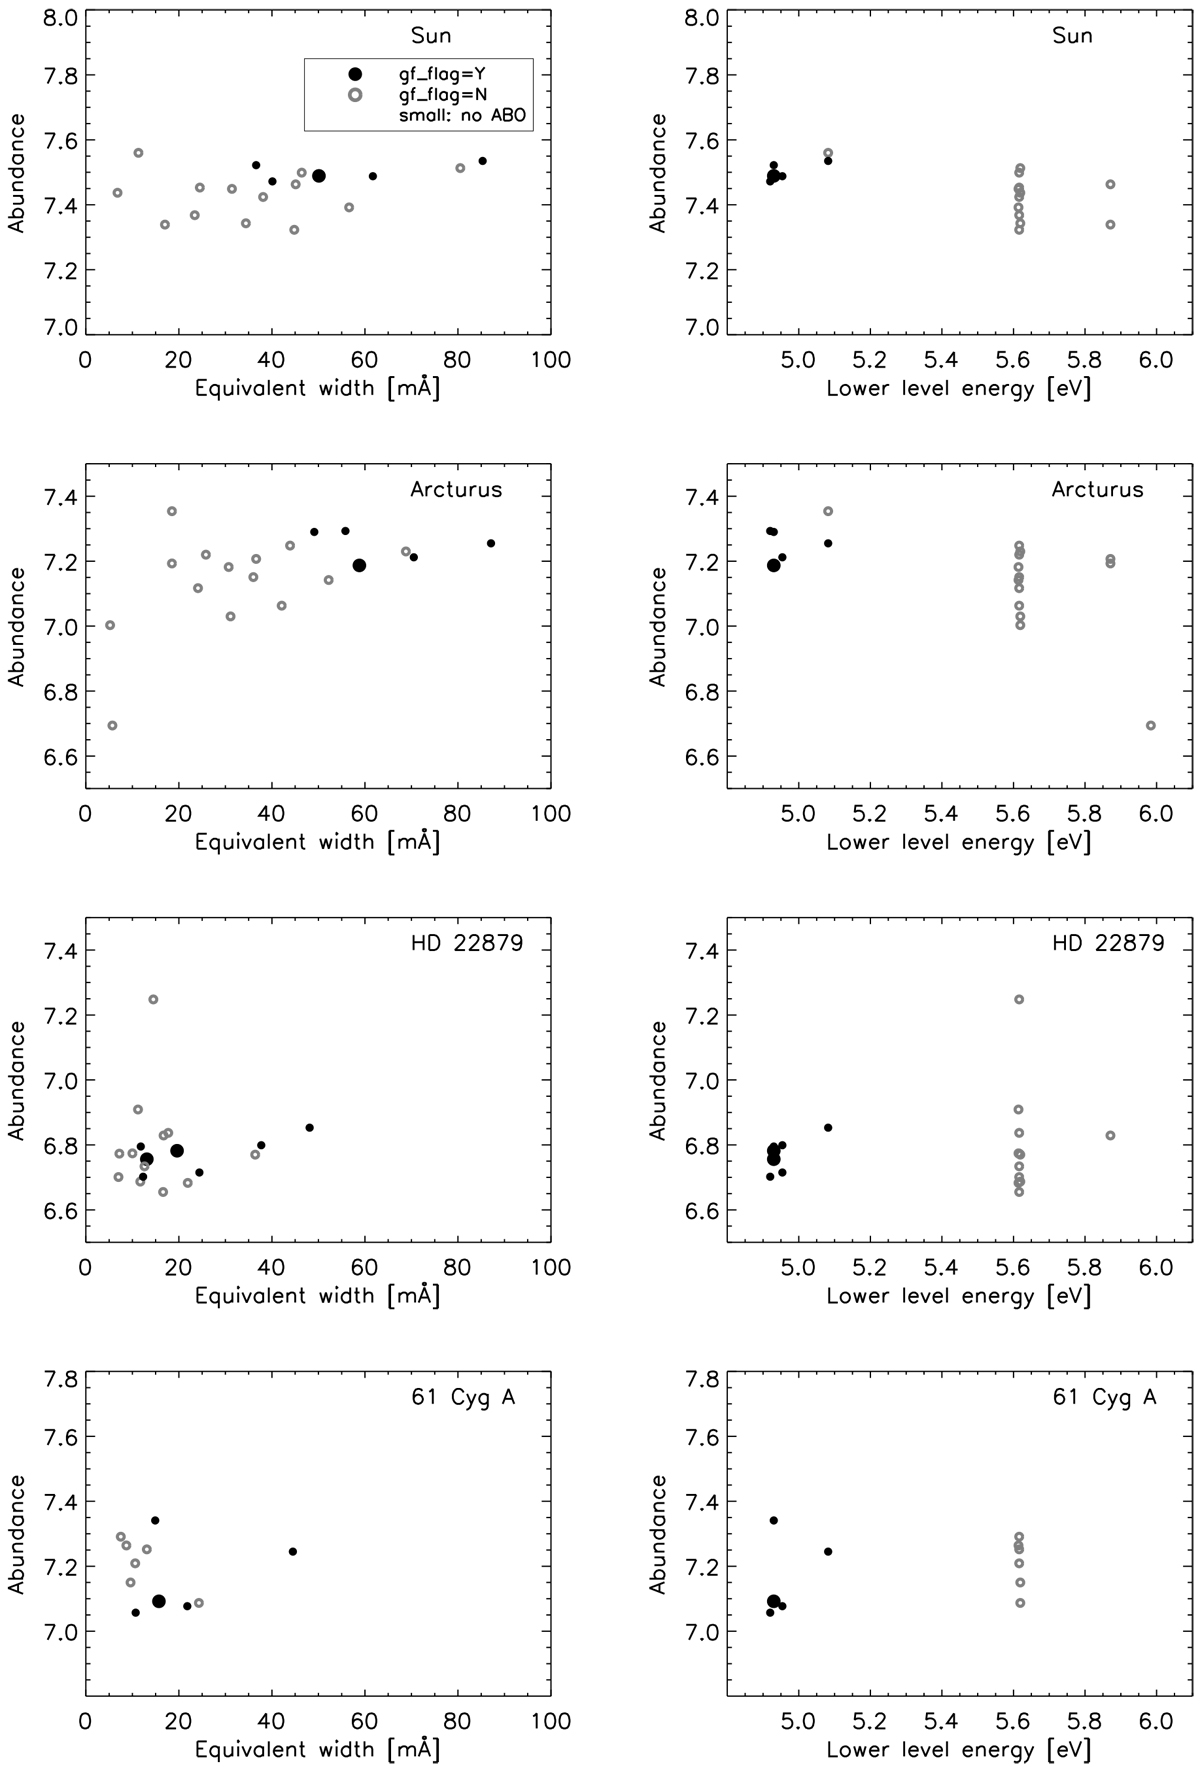
Line-by-line Si I abundances determined for four benchmark stars for two groups of lines with different quality assessment of their transition probabilities, as a function of equivalent width and lower level energy. Abundances are given as log (εSi) + 12, where εSi = NSi∕NH. Only lines with synflag = Y or U and with equivalent widths >5 mÅ are included.
Current usage metrics show cumulative count of Article Views (full-text article views including HTML views, PDF and ePub downloads, according to the available data) and Abstracts Views on Vision4Press platform.
Data correspond to usage on the plateform after 2015. The current usage metrics is available 48-96 hours after online publication and is updated daily on week days.
Initial download of the metrics may take a while.