Fig. 4
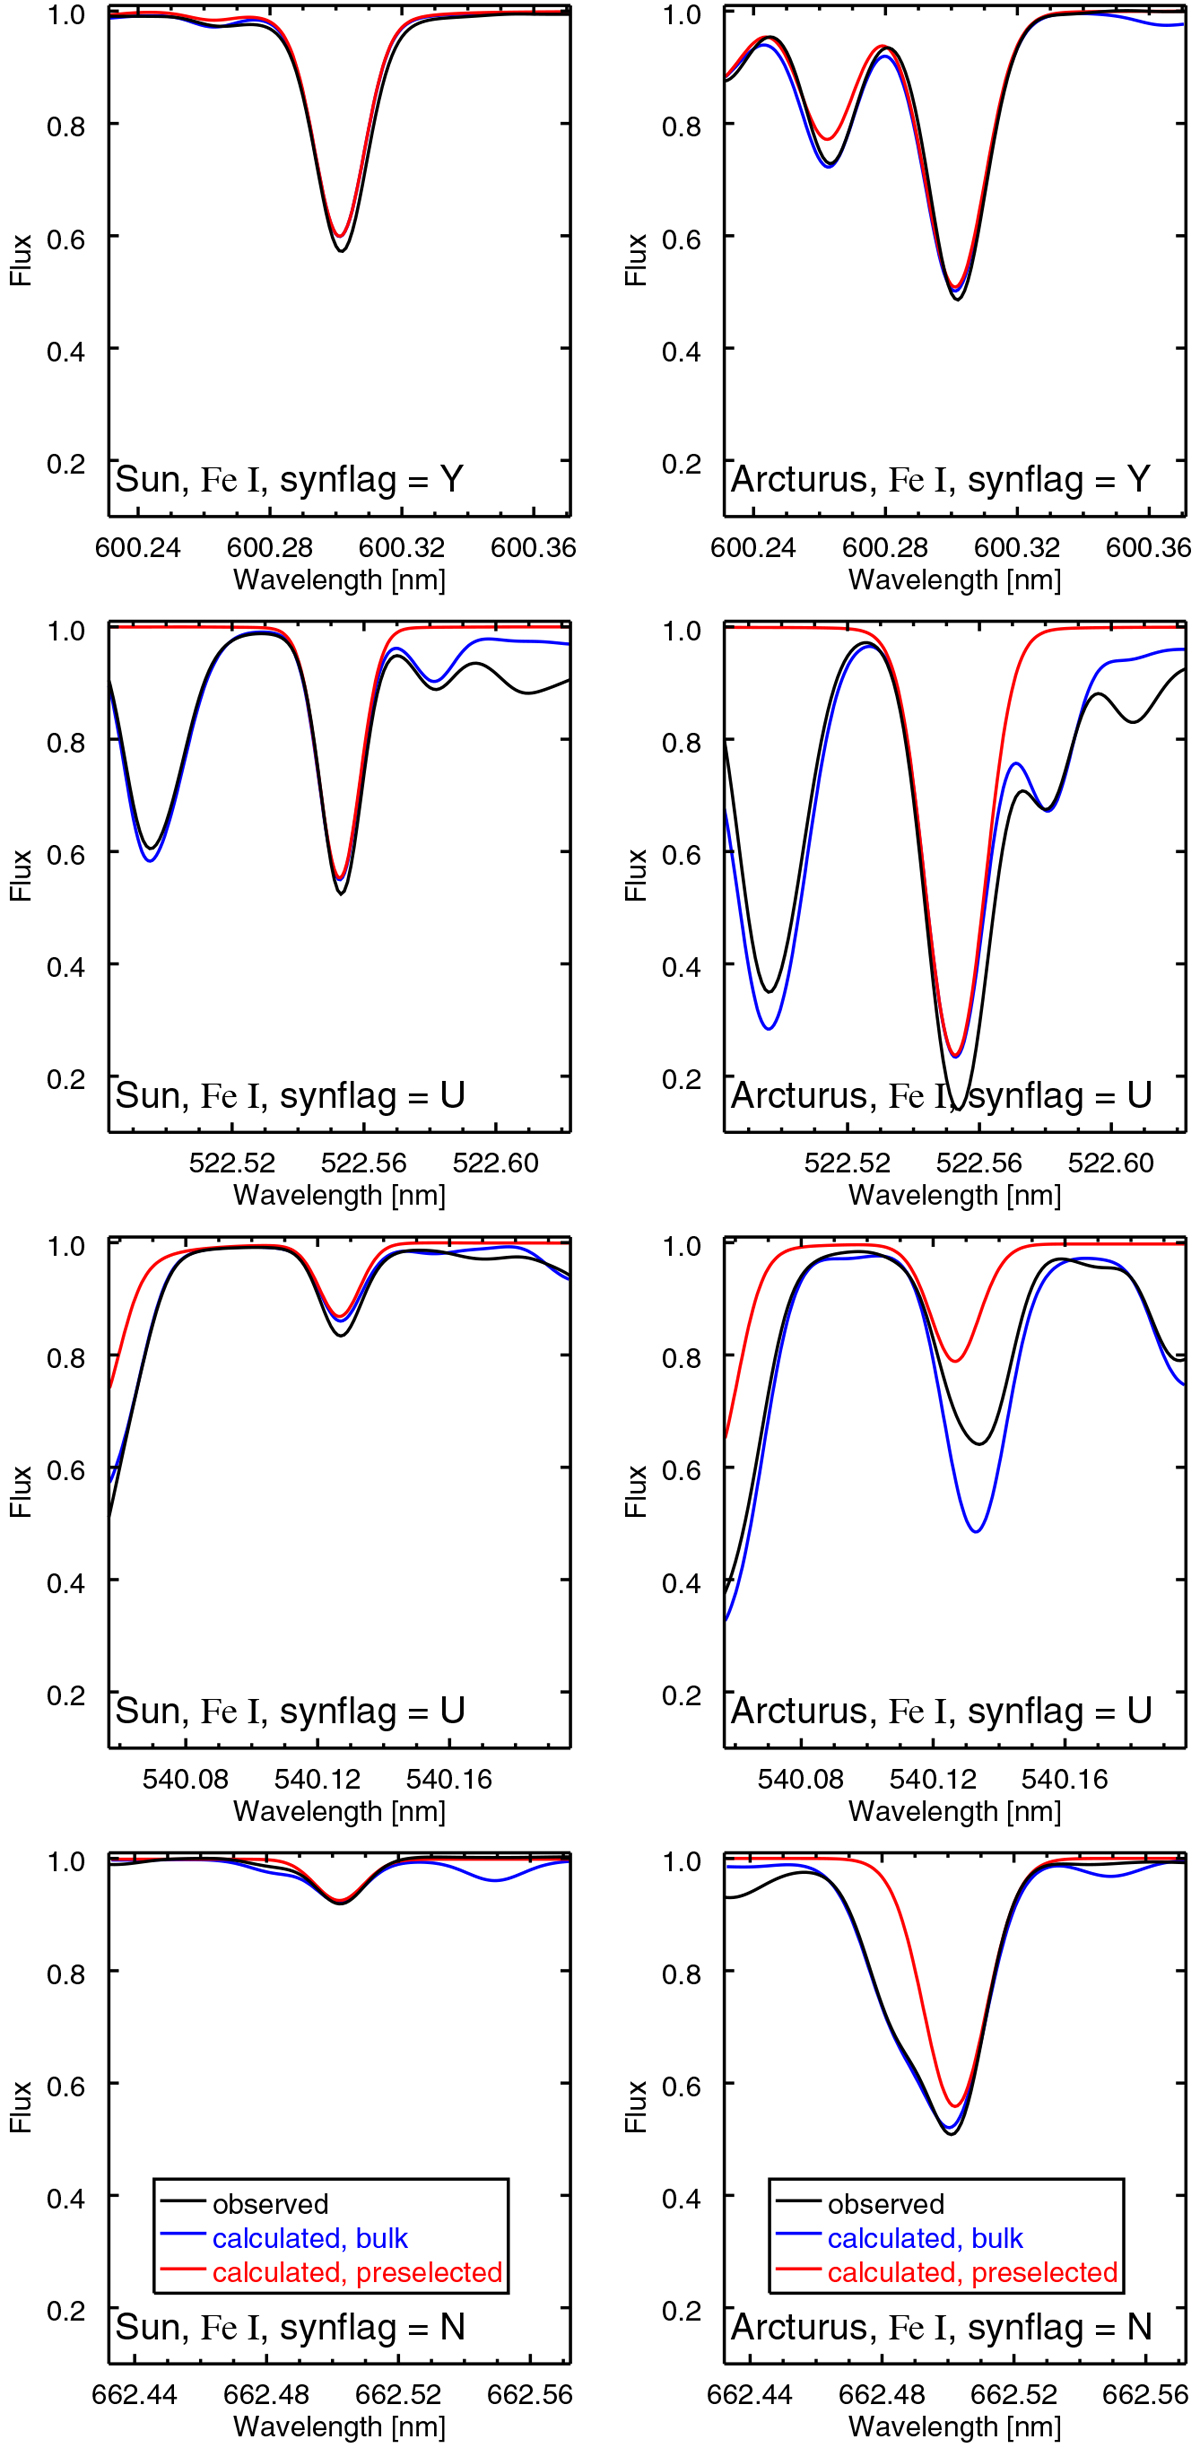
Comparison of observed and calculated line profiles around four of the preselected Fe I lines with different synflag assignments for the Sun (left) and Arcturus (right). Black lines: observations, red lines: calculations including preselected spectral lines only, blue lines: calculations using the Gaia-ESO bulk line list, including preselected and background lines. All of these lines have gf_flag = Y.
Current usage metrics show cumulative count of Article Views (full-text article views including HTML views, PDF and ePub downloads, according to the available data) and Abstracts Views on Vision4Press platform.
Data correspond to usage on the plateform after 2015. The current usage metrics is available 48-96 hours after online publication and is updated daily on week days.
Initial download of the metrics may take a while.