Free Access
Fig. B.17
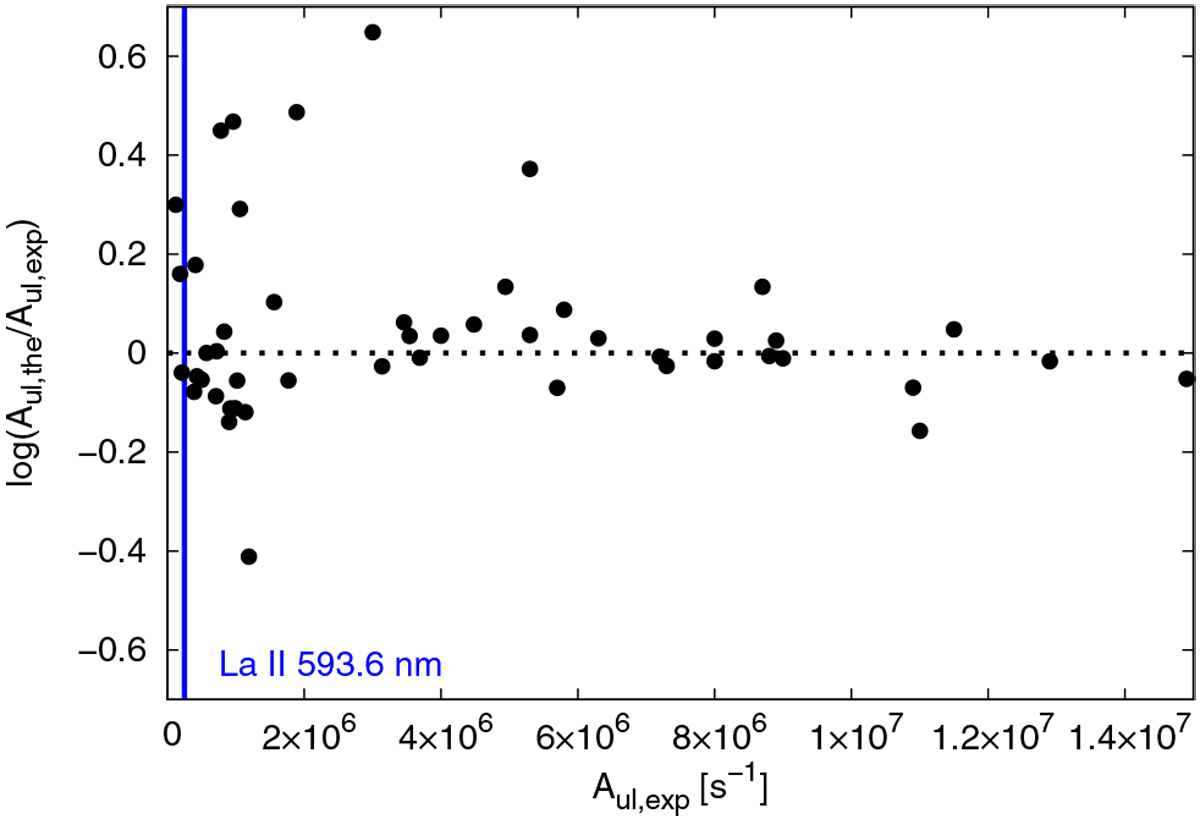
Comparison between theoretical (the) and experimental (exp) transition probabilities Aul for La II. Data are from Kułaga-Egger & Migdałek (2009) and Lawler et al. (2001a), respectively. The blue vertical line indicates the location of the line at 593.6 nm.
Current usage metrics show cumulative count of Article Views (full-text article views including HTML views, PDF and ePub downloads, according to the available data) and Abstracts Views on Vision4Press platform.
Data correspond to usage on the plateform after 2015. The current usage metrics is available 48-96 hours after online publication and is updated daily on week days.
Initial download of the metrics may take a while.