Free Access
Fig. 2
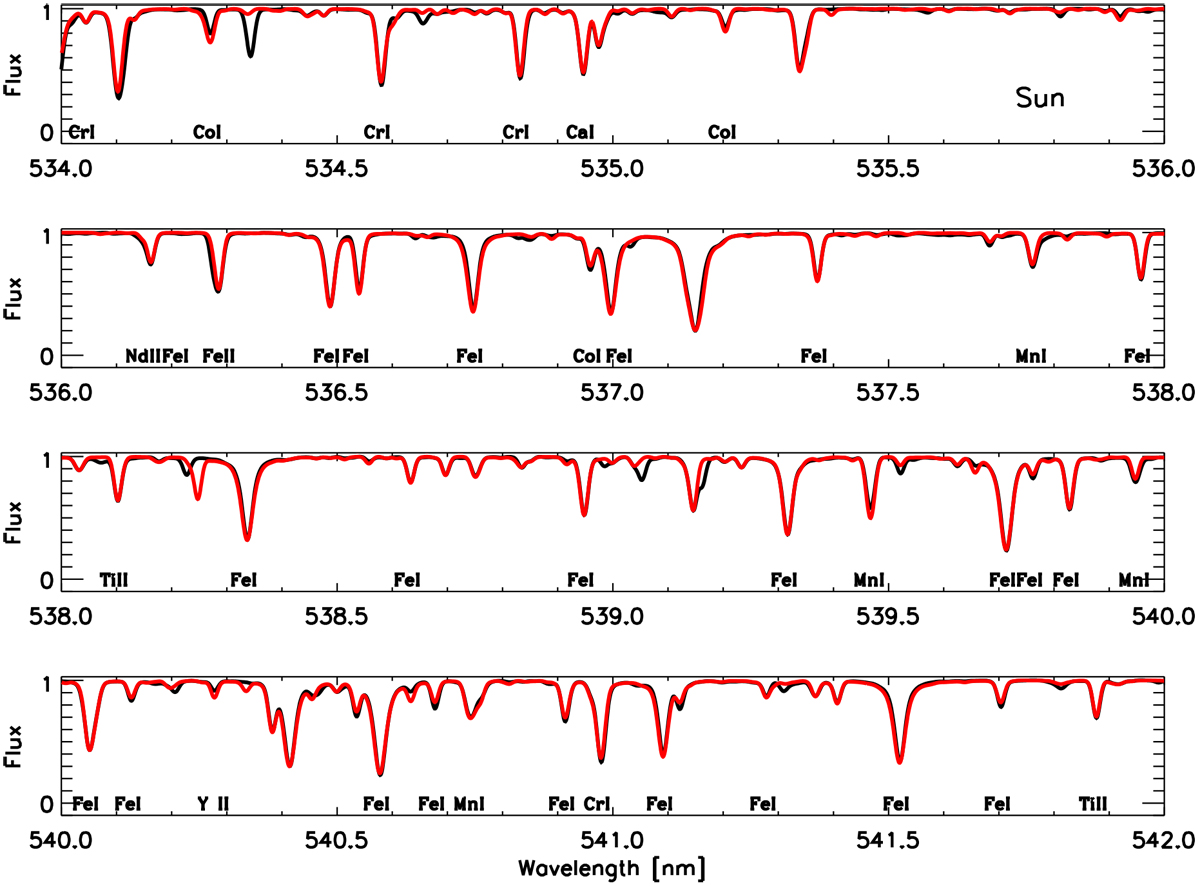
Observed (black) and calculated (red) spectra for the Sun for an 8 nm-wide interval in the optical region. The Gaia-ESO bulk line list was used as input for the calculations, which includes preselected and background lines. Some of the strongest preselected lines are labelled by their species.
Current usage metrics show cumulative count of Article Views (full-text article views including HTML views, PDF and ePub downloads, according to the available data) and Abstracts Views on Vision4Press platform.
Data correspond to usage on the plateform after 2015. The current usage metrics is available 48-96 hours after online publication and is updated daily on week days.
Initial download of the metrics may take a while.