Fig. B.11
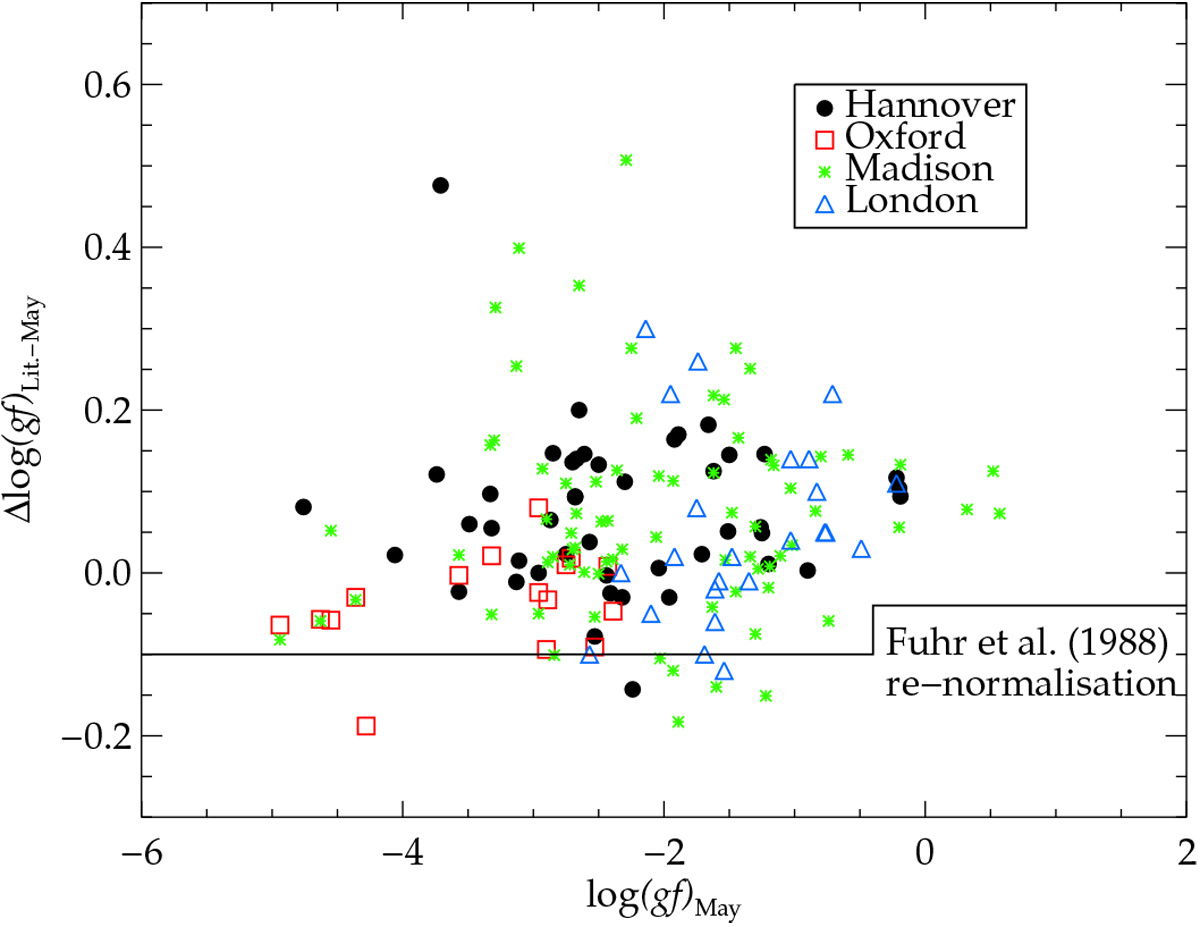
Comparison of Fe I transition probabilities published by May et al. (1974) to newer, more accurate data from the Oxford, Madison, Hannover, and London groups (see text for references). The solid line indicates the proposed normalisation of the May et al. (1974) values by Fuhr et al. (1988). Applying this normalisation would shift the zero-point on the vertical axis to the solid line (while the data points would remain at the same positions relative to the solid line). All published spectral lines in the wavelength region 476 to 895 nm are shown.
Current usage metrics show cumulative count of Article Views (full-text article views including HTML views, PDF and ePub downloads, according to the available data) and Abstracts Views on Vision4Press platform.
Data correspond to usage on the plateform after 2015. The current usage metrics is available 48-96 hours after online publication and is updated daily on week days.
Initial download of the metrics may take a while.