Fig. B.7
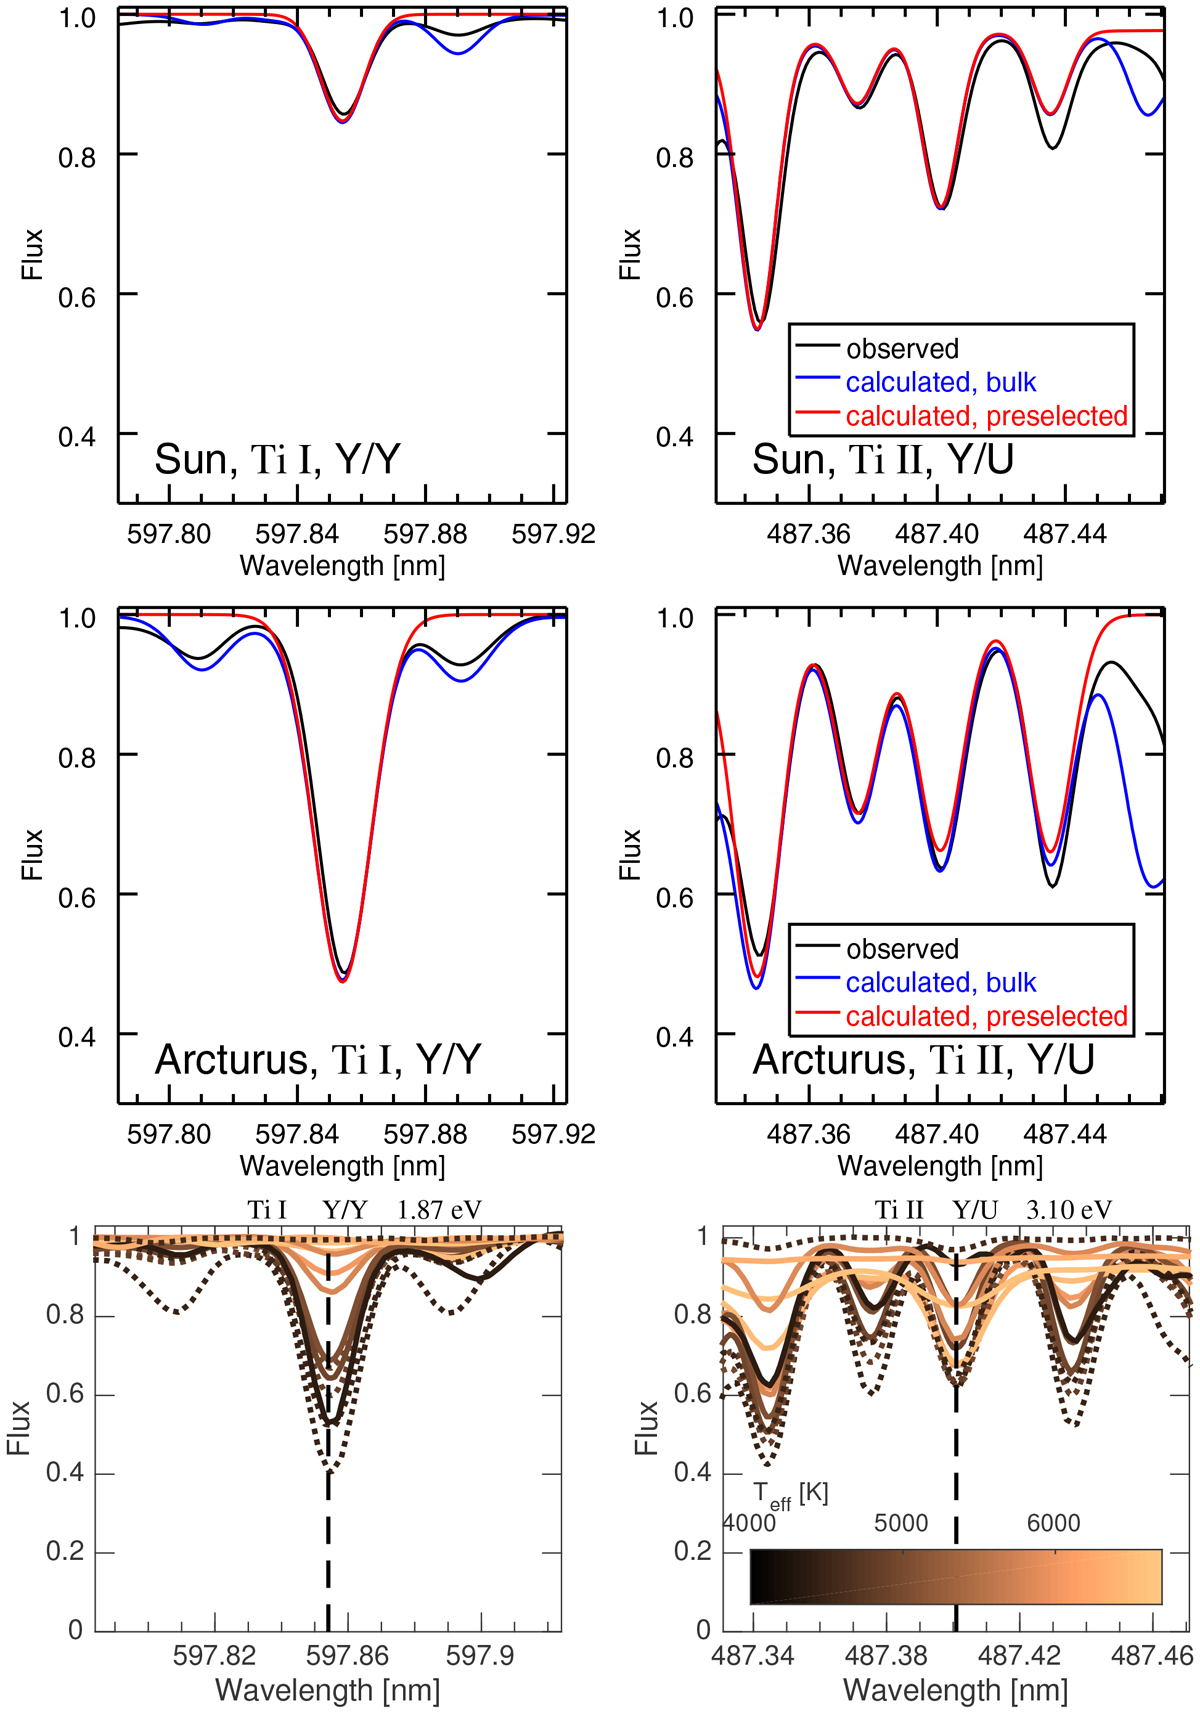
Observed and calculated line profiles around two preselected Ti I and Ti II lines for the Sun (top row) and Arcturus (middle row). Black lines: observations, red lines: calculations including preselected spectral lines only, blue lines: calculations including blends from background line list. Bottom row: line profiles generated from observed spectra of selected Gaia FGK benchmark stars. See Sect. 2.3.
Current usage metrics show cumulative count of Article Views (full-text article views including HTML views, PDF and ePub downloads, according to the available data) and Abstracts Views on Vision4Press platform.
Data correspond to usage on the plateform after 2015. The current usage metrics is available 48-96 hours after online publication and is updated daily on week days.
Initial download of the metrics may take a while.