Fig. 1.
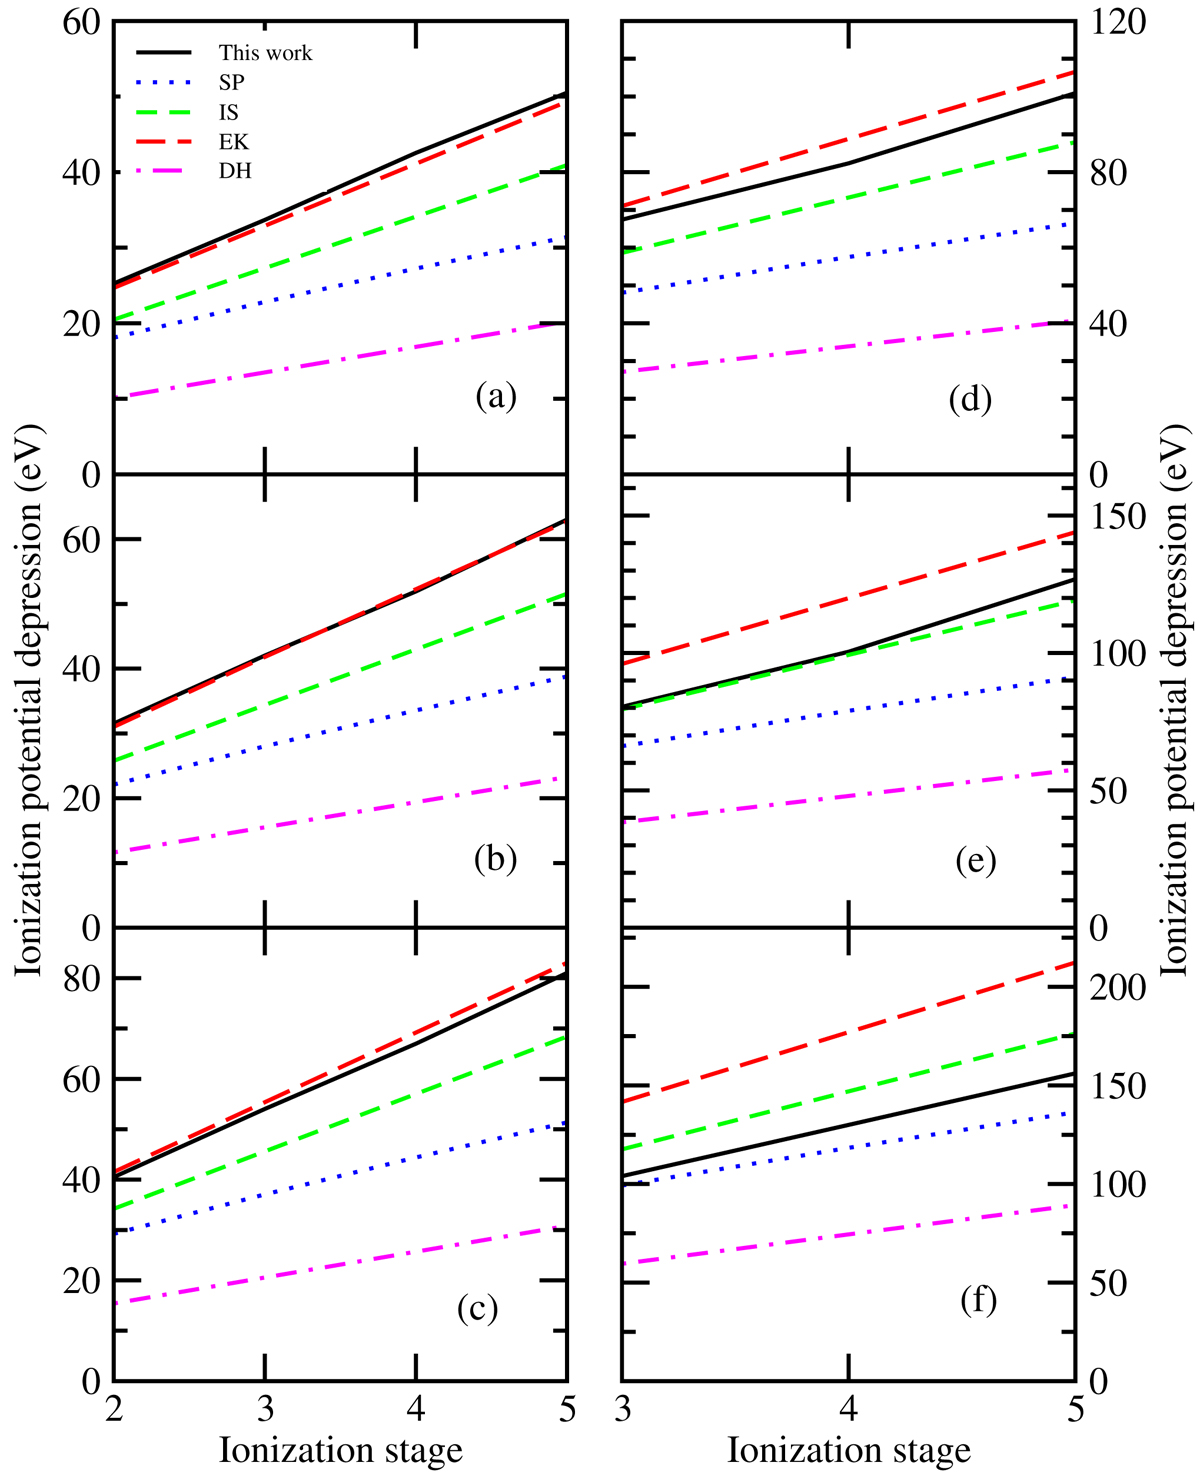
Ionization potential depressions of C plasma at electron temperatures and densities of 120 eV and 4.30 × 1022 cm−3 (a), 189.00 eV and 8.70 × 1022 cm−3 (b), 251 eV and 2.06 × 1023 cm−3 (c), 303 eV and 4.32 × 1023 cm−3 (d), 373 eV and 1.06 × 1024 cm−3 (e), and 496 eV and 3.51 × 1024 cm−3 (f). These plasma conditions are deduced from the standard solar model (Bahcall & Ulrich 1988; Guenther et al. 1992) at radius fractions of 0.796 R⊙, 0.7133 R⊙, 0.6195 R⊙, 0.5442 R⊙, 0.4597 R⊙, and 0.3529 R⊙, respectively. Our results are compared with those of the Debye–Hückel (DH; Debye & Hückel 1923), Stewart–Pyatt (SP; Stewart & Pyatt 1966), ion-sphere (IS; Rozsnyai 1972), and Ecker–Kröll (EK; Ecker & Kröll 1963) analytical models. The description of the line style shown in plot (a) applies to all plots (a)–(f).
Current usage metrics show cumulative count of Article Views (full-text article views including HTML views, PDF and ePub downloads, according to the available data) and Abstracts Views on Vision4Press platform.
Data correspond to usage on the plateform after 2015. The current usage metrics is available 48-96 hours after online publication and is updated daily on week days.
Initial download of the metrics may take a while.