| Issue |
A&A
Volume 644, December 2020
|
|
|---|---|---|
| Article Number | A158 | |
| Number of page(s) | 10 | |
| Section | The Sun and the Heliosphere | |
| DOI | https://doi.org/10.1051/0004-6361/202039000 | |
| Published online | 15 December 2020 | |
A statistical study of plasmoids associated with a post-CME current sheet⋆
1
Indian Institute of Astrophysics, 2nd Block Koramangala, Bangalore 560034, India
2
Aryabhatta Research Institute of Observational Sciences, Nainital 263001, India
3
Instituto de Astrofisíca de Canarias, 38205 La Laguna, Tenerife, Spain
4
Departamento de Astrofisíca, Universidad de La Laguna, 38206 La Laguna, Tenerife, Spain
e-mail: vaibhavpant55@gmail.com
5
Centre for mathematical Plasma Astrophysics, Department of Mathematics, KU Leuven, Leuven 3001, Belgium
6
Institute of Theoretical Astrophysics, University of Oslo, PO Box 1029 Blindern, 0315 Oslo, Norway
7
Rosseland Centre for Solar Physics, University of Oslo, PO Box 1029 Blindern, 0315 Oslo, Norway
8
Center of Excellence in Space Science, IISER Kolkata, Kolkata 741246, India
Received:
22
July
2020
Accepted:
7
October
2020
Context. Coronal mass ejections (CMEs) are often observed to be accompanied by flare, current sheets, and plasmoids/plasma blobs. 2D and 3D numerical simulations and observations reported plasmoids moving upward as well as downward along the current sheet.
Aims. We aim to investigate the properties of plasmoids observed in the current sheet formed after an X-8.3 flare and followed by a fast CME eruption on September 10, 2017 using extreme-ultraviolet (EUV) and white-light coronagraph images. The main goal is to understand the evolution of plasmoids in different spatio-temporal scales using existing ground- and space-based instruments.
Methods. We identified the plasmoids manually and tracked them along the current sheet in the successive images of Atmospheric Imaging Assembly (AIA) taken at the 131 Å pass band and in running difference images of the white-light coronagraphs, K-Cor and LASCO/C2. The location and size of the plasmoids in each image were recorded and analyzed, covering the current sheet from the inner to outer corona.
Results. We find that the observed current sheet has an Alfvén Mach number of 0.018−0.35. The fast reconnection is also accompanied by plasmoids moving upward and downward. We identified 20 downward-moving and 16 upward-moving plasmoids using AIA 131 Å images. In white-light coronagraph images, only upward-moving plasmoids are observed. Our analysis shows that the downward-moving plasmoids have an average width of 5.92 Mm, whereas upward-moving blobs have an average size of 5.65 Mm in the AIA field of view (FOV). The upward-moving plasmoids, when observed in the white-light images, have an average width of 64 Mm in the K-Cor, which evolves to a mean width of 510 Mm in the LASCO/C2 FOV. Upon tracking the plasmoids in successive images, we find that downward- and upward-moving plasmoids have average speeds of ∼272 km s−1 and ∼191 km s−1, respectively in the EUV channels of observation. The average speed of plasmoids increases to ∼671 km s−1 and ∼1080 km s−1 in the K-Cor and LASCO/C2 FOVs, respectively, implying that the plasmoids become super-Alfvénic when they propagate outward. The downward-moving plasmoids show an acceleration in the range of −11 km s−1 to over 8 km s−1. We also find that the null point of the current sheet is located at ≈1.15 R⊙, where bidirectional plasmoid motion is observed.
Conclusions. The width distribution of plasmoids formed during the reconnection process is governed by a power law with an index of −1.12. Unlike previous studies, there is no difference in trend for small- and large-scale plasmoids. The evolution of width W of the plasmoids moving at an average speed V along the current sheet is governed by an empirical relation: V = 115.69W0.37. The presence of accelerating plasmoids near the neutral point indicates a longer diffusion region as predicted by MHD models.
Key words: Sun: corona / Sun: flares / magnetic reconnection / instabilities / methods: statistical
Movies are available at https://www.aanda.org
© ESO 2020
1. Introduction
Coronal mass ejections (CMEs) are the large expulsions of plasma and magnetic field into the interplanetary space, which are observed as a distinct bright structure moving radially outward in the white-light coronagraph images (Hundhausen et al. 1984). Their origins have been primarily accounted for by two mechanisms. One is from the prominence eruptions, and the other is due to flaring active regions (Moon et al. 2002). Magnetic reconnection has been the driver for these flares, and a number of models have been proposed to explain such a phenomenon. The classical Sweet-Parker model (Sweet 1958; Parker 1957) was the first theoretical framework to explain the magnetic reconnection in oppositely directed magnetic field lines in plasma and in the formation of the current sheet. However, the reconnection rate given by this model is much slower than those observed in the solar corona. The Sweet-Parker model was modified by reducing the size of resistive layer in the reconnection region, thereby speeding up the reconnection rate (Petschek 1964). A simplified 2D model, CSHKP, was put forward to explain the flares and related observed phenomena such as flare ribbons and post-flare loops (Carmichael 1964; Sturrock 1966; Hirayama 1974; Kopp & Pneuman 1976). This was extended to a plasmoid-induced reconnection model by Shibata (1996, 1997). It was also suggested that the magnetic reconnection plays a major role in the CME acceleration. It was proposed that in an isothermal atmosphere, the average Alfvén Mach number (MA) for the inflow into the reconnection region (as low as 0.005) is sufficient to cause an eruption (Lin & Forbes 2000). This limit was increased to 0.013 taking into account a more realistic plasma atmosphere (Sittler & Guhathakurta 1999; Lin 2002). Shibata & Tanuma (2001) showed that the ejection of plasmoids from the current sheet leads to a highly time-dependent and faster reconnection at different spatial and temporal scales. Vršnak et al. (2003) estimated that during the onset of the fast reconnection process, the ratio of width to length of the current sheet lies in a range of 1/18−1/9, leading to tearing mode instability and the formation of plasmoids. The role of plasmoid instability in the fast reconnection rate was reported in Bhattacharjee et al. (2009) and Huang & Bhattacharjee (2010). Theoretically, it is proposed that in the current sheets with high Lundquist numbers, the distribution function f(ψ) of the magnetic flux ψ associated with plasmoids follows a power law, f(ψ) ∼ ψ−1 (Huang & Bhattacharjee 2012). However, due to the lack of magnetic field measurements in the corona, this could not be verified observationally. In an ultra-high-resolution 2.5D simulation, Guidoni et al. (2016) studied the evolution of magnetic islands formed in the current sheet and found that the contraction of these islands may provide enough energy to accelerate particles. The plasmoids formed in a gravitationally stratified current sheet during the reconnection process move upward and downward. Moreover, small plasmoids merge to form larger plasmoids that show oscillatory behavior in their size as they propagate. Furthermore, downward-propagating plasmoids cause the underlying post-flare loops to oscillate upon interaction (Jelínek et al. 2017).
The theoretical models have always been improved to support the observations. During the 2002 July 23 solar flare, it was found that the downflow motions are correlated with the release of the magnetic energy (Asai et al. 2004). The observations of flows in post-CME current sheets are limited by the resolution of the current instruments. Savage et al. (2010, and references therein) reported the observations of supra-arcade downflows (SADs), observed as dark density-depleted structures moving sunward and associated with flare leading to CME eruption, using multiwavelength data. On the other hand, plasmoids are bright density-enhanced features observed as blobs in the current sheet identified in white-light images of the Large Angle and Spectrometric Coronagraph (LASCO; Brueckner et al. 1995) and have been reported by Ko et al. (2003), Riley et al. (2007), Schanche et al. (2016), Webb & Vourlidas (2016), and Chae et al. (2017). The observations of slowly drifting structures in radio wavelengths also provided signatures of downward-moving plasmoids along the current sheet (Kliem et al. 2000; Ning et al. 2007). These are associated with the secondary tearing happening in the current sheet and the coalescence of smaller plasmoids to form the larger ones. Evidence of bidirectional plasmoids during the reconnection using multiwavelength observations were reported in Kumar & Cho (2013) and Takasao et al. (2012). In recent studies of the observed current sheet of 2017 September 10, downflows have been observed and associated with the reconnection (Longcope et al. 2018; Hayes et al. 2019; Lee et al. 2020; Yu et al. 2020).
The scales of the observed moving structures associated with reconnection have been analysed in recent studies in order to understand the spatial and temporal scales present. A statistical study of SADs observed during flares revealed that SAD size follows a log-normal distribution, whereas the flux follows both a log-normal and an exponential distribution (McKenzie & Savage 2011). In another statistical study using the LASCO observations, plasmoid sizes were found to have two distributions. The number of blobs first increases and later decreases with an increase in the widths (Guo et al. 2013). It was also compared with a resistive MHD simulation, and the possibility of a power-law distribution was suggested, which differs from the log-normal distribution as proposed by McKenzie & Savage (2011) for donwflowing structures.
Apart from the size of plasmoids, their kinematical properties have been reported in various studies. When the blobs in the LASCO images were observed with an average speed ranging from 300 to 650 km s−1, it was suggested that the plasmoids move with local Alfvén speed in the current sheet after the reconnection (Ko et al. 2003). For 2003 November 9, a current sheet was identified in the wake of the CME along which five blobs were observed in the LASCO FOV. These blobs were recorded with an average speed range of 460−1075 km s−1 (Lin et al. 2005). Employing a 2D reistive-MHD simulation for magnetic reconnection, it was reported that the upward-moving plasmoids gain the highest speed of the order of ambient Alfvén speed (VA), whereas the downward-moving plasmoids attain only a fraction of this speed (Bárta et al. 2008; Forbes et al. 2018). In a study combining extreme ultra-violet (EUV) and radio observations, bidirectional plasmoids formed during the reconnection were observed to be moving at speeds of ∼152−362 km s−1 and ∼83−254 km s−1, respectively (Kumar & Cho 2013). An average speed of 307 km s−1 with a spread from 93 to 723 km s−1 was derived using LASCO/C2 images and by identifying and tracking nine upward-moving blobs associated with different CMEs (Schanche et al. 2016). In a recent statistical study, the blobs were identified in LASCO coronagraph images over minima (1996−98) and maxima (2001) of solar cycle 23. Their speed range was found to be 245−462 km s−1, which is associated with ∼130 post-CME current sheets(/rays) (Webb & Vourlidas 2016). It was reported in Forbes et al. (2018) that due to limited observations, the upward-moving blobs do not show variation in speed along the current sheet, whereas deceleration was observed for downward-directed blobs. This was unlike the kinematic behavior of plasmoids obtained from their simulation. In a candidate current sheet associated with a CME observed by COR-2 on-board the Solar TErrestrial RElations Observatory (STEREO; Howard et al. 2002), the plasma blobs were tracked using an automated method and were found to have an average speed of 303 km s−1, with the starting height of blob formation being 0.5 R⊙ above the solar surface (Chae et al. 2017).
In spite of several statistical and theoretical studies, we do not have a clear understanding of the plasmoids’ evolution during the reconnection process. In this study, we investigated the properties of plasmoids observed in a post-CME current sheet in multiwavelength data on 2017 September 10. We analysed the size distribution of the observed plasmoids in different pass bands extending the lower limit, which shows a power-law distribution rather than a log-normal one (Guo et al. 2013). We also studied their speed distribution over different heights in the solar corona and tried to correlate them with their size during propagation. We identified the primary disconnection point in the current sheet using the plasmoids’ direction-of-motion information. The instruments used for the observed data are presented in Sect. 2. We describe the procedures followed to derive the Alfvén Mach number for the current sheet and to identify plasmoids, and we give the results of the statistical properties of the observed plasmoids as well as determining the disconnection location in the current sheet in Sect. 3. Section 4 summarizes our interpretation of the results followed by a discussion.
2. Observations
An X8.3 flare occured on 2017 September 10 at the NOAA active region (AR) 12673 near the west limb of the Sun and is associated with a fast CME of speed 3200 km s−1 (Gopalswamy et al. 2018; Veronig et al. 2018). This event also led to the formation of a current sheet at ∼16:10 UT above the location of a flare for a very long time and has been reported in recent studies (Gary et al. 2018; Polito et al. 2018; Cheng et al. 2018; French et al. 2019; Yan et al. 2018; Warren et al. 2018; Hayes et al. 2019; Yu et al. 2020; Lee et al. 2020).
We used EUV images of the Atmospheric Imaging Assembly (AIA) onboard the Solar Dynamics Observatory (SDO; Lemen et al. 2012) taken at the 131 Å pass band for high-resolution observation near the solar limb, starting from 15:30 UT to 19:00 UT. These images with a pixel resolution of 0.6 arcsec were reduced to level 1.5 using the standard IDL routine, aia_prep.pro, to correct for the rotation, alignment, and adjust the plate scale. We used images with exposure times of ∼2.9 s with a cadence of 24 s. The current sheet is also observed in white-light coronagraph images of the K-Cor telescope at Mauna Loa Solar Observatory (MLSO) (de Wijn et al. 2012) and the Large Angle Spectroscopic Coronagraph (LASCO) on-board the Solar and Heliospheric Observatory (SOHO) (Brueckner et al. 1995). We used the available K-Cor level 1 images processed with a normalizing radial graded filter (NRGF) (Morgan et al. 2006) with a field of view (FOV) from 1.05 R⊙ to 3 R⊙ at a cadence of two minutes and resolution of 5.6 arcsec pixel−1 from 17:00 UT to 19:00 UT.
The observed current sheet is shown in Fig. 1, where the top panel shows a K-Cor observation, while an AIA 131 Å observation for a smaller FOV is shown in the bottom panel. The region of interest (ROI) was chosen along the current sheet and is highlighted by a green box in the K-Cor image (ROI-A). A smaller region in the same image shown in an orange box corresponds to the ROI in the AIA 131 Å images (ROI-B). The red dashed line along the current sheet in the bottom panel of Fig. 1 was used to generate the height-time plot. A careful observation of ROI-B in successive AIA images revealed some of the plamoids moving upward, while others were moving downward toward the Sun along the current sheet. The signature of plasmoids is also noted in the K-Cor images. An animation is available for Fig. 1 showing the identified plasmoids in the K-Cor FOV. Moreover, we used LASCO/C2 images with a cadence of 12 min and pixel resolution of 11.4 arcsec pixel−1 to track the outward-moving plasmoids up to 6 R⊙. The images from the LASCO/C3 coronagraph, with FOVs from 4 to 30 R⊙ and spatial resolutions of 56 arcsec pixel−1 were used to observe the current sheet further into the corona.
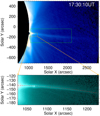 |
Fig. 1. Context image for the observed current sheet in K-Cor data. Green rectangular box in the top panel corresponds to ROI-A chosen for the analysis in the K-Cor data. The orange box represents the ROI-B chosen in the AIA 131 Å passband data, which is shown in the bottom panel. The red dashed line along the identified current sheet is used for generating a height-time plot (an animation is available online for this figure). |
3. Analysis and results
Images of AIA 131 Å were radially filtered using aia_rfilter.pro, which is available in the Solarsoft package of IDL, enhancing the off-limb features. This resulted in visualisation of the current sheet at up to ∼1.3 R⊙. It also enhanced the brightness of anti-sunward-moving plasmoids/plasma blobs up to larger distances. Henceforth, anti-sunward- and sunward-moving plasmoids are referred to as upward- and downward-moving plasmoids, respectively. The features in the EUV difference images were further enhanced with intensity scaling for better visualisation. Furthermore, LASCO/C2 and C3 images were also processed with a radial filter to identify the features throughout their FOVs.
3.1. Estimation of the Alfvén Mach number
It can be seen in Fig. 1 that the identified current sheet is visible in pass bands extending from EUV to white light. We estimated the length of the current sheet in the inner corona using AIA 131 Å images and further in white-light coronagraph images extending to the outer corona using K-Cor and LASCO coronagraphs following the procedure reported in Lin & Forbes (2000) and Savage et al. (2010). Assuming that the lower end of the current sheet (p) remains fixed over the post-flare loops (∼1.03 R⊙), the length of the current sheet is estimated to from p to the height observed (q) in the AIA, K-Cor, and LASCO coronagraphs’ composite images as shown in Fig. 2, where the red line shows the length of the current sheet. The box at the end represents the uncertainty in measurement of its length. Multiple measurements were taken to increase the accuracy of the length of the current sheet. The average width of the current sheet measured in the EUV pass band using AIA 131 Å images is estimated to be ∼9 Mm between 1.03 and 1.1 R⊙ in height. The average width of the current sheet in white-light images of LASCO/C2 is measured to be ∼90 Mm below 2.5 R⊙, whereas in K-Cor images it is estimated to be ∼20 Mm averaged over heights from 130 to 390 Mm. The width measurements are close to the values reported by Cheng et al. (2018), that is, ∼10 Mm in EUV images and ∼25 Mm in white light (K-Cor) for the same current sheet. The measured width of the current sheet is wider than the theoretical predictions due to the fact that we took measurements based on the density of the plasma surrounding the structure. Furthermore, the thermal conduction in the reconnection region heats the surrounding plasma and is responsible for slow mode shocks and flows along the current sheet, which leads to the identification of a wider current sheet (Seaton & Forbes 2009).
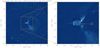 |
Fig. 2. Composite image of AIA 193 Å, K-Cor, LASCO-C2, and C3 for 2017 September 10 at 17:05 UT. A close view of the inner FOV is shown in a subsequent image with the length of current sheet shown by the red line. The white rectangular box represents the approximate error in estimating the length of the current sheet. |
The Alfvén Mach number (MA) is estimated as the ratio of width and length of the current sheet, where the length is determined by q − p (Lin & Forbes 2000; Savage et al. 2010). The value of MA is plotted with time in the observed current sheet as shown in Fig. 3. The points in blue are the measurements made using AIA 131 Å images in the inner corona, whereas the red points correspond to LASCO image estimations. The jump in the estimated values after 16:00 UT may be due to the fact that two different pass bands have been used here for the estimation of the current sheet dimensions. The values obtained range from 0.018 to 0.35, which satisfies the lower limit of MA proposed by Lin & Forbes (2000) and Lin (2002) at which eruption can occur. MA near the reconnection site also represents the rate of reconnection. The reconnection rate of 0.003−0.2 was reported in Cheng et al. (2018) and was estimated by taking the inflow-to-outflow-velocity ratio at the reconnection site using AIA 193 Å images for this event. It should be noted that K-Cor images are available from ∼17:00 UT when the current sheet was already visible in LASCO/C2 FOV. The MA for this event is higher than the values obtained for the current sheet reported by Savage et al. (2010) as 0.002−0.006, which is comparable to the earlier estimated values reported in Ko et al. (2003), Lin et al. (2005), Bemporad et al. (2006), Ciaravella & Raymond (2008), and Takasao et al. (2012), and lower than the range of 0.15−0.27 estimated for a novel forced reconnection observed on 2012 May 3 (Srivastava et al. 2019).
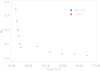 |
Fig. 3. Evolution of estimated Alfvén Mach number (MA) with time using width/length relation of current sheet. The blue points are the MA estimated using AIA 131 Å images for current sheet length measurement, whereas the red ones belong to LASCO images. |
3.2. Identification of plasmoids in the current sheet
It should be noted that the estimated MA satisfies the requirement proposed by Vršnak et al. (2003) for the formation of plasmoids during the reconnection process. We find that there are plasmoids along the current sheet in both EUV and white-light observations. Plasmoids were identified by visual inspection using discrete intensity enhancements moving along the current sheet in AIA images taken at 131 Å, and white-light images of K-Cor and LASCO/C2. In general, plasmoids are characterized by the O point, and hence termed as the magnetic islands. Thus, using only intensity images, it is difficult to distinguish plasmoids from flows. Therefore, we have to rely on the shape, and we thus classified near-elliptical and elongated confined intensity structures as the plasmoids in contrast with continuous plasma motion in the case of flows. We inferred the direction of motion of plasmoids after tracking them in consecutive images. It is important to note that plasmoids are identified as brightness enhancements due to increased density. These are different to the SADs reported in Savage et al. (2010) and McKenzie & Savage (2011), which are identified as depleted densities, and hence observed as dark features in successive frames. Figure 4 shows an example of such plasmoids. We manually added contours around these structures by observing the significant change in the intensity around the plasmoids taken as the edges. The upward-moving plasmoids are outlined with white contours, while the downward-moving ones are outlined in red. The same ones were also marked in Fig. 4 (and its associated animation available online) using AIA 131 Å images. The animation consists of intensity images on the left side and radial filtered difference images with scaled intensities on the right. Upon careful inspection, the blobs could also be identified in the original intensity images at the locations marked in the difference images in Fig. 4. The temporal locations of these plasmoids were also verified with the help of the height-time plot shown in the middle panel of the same figure. It should be noted that the bidirectional blobs are produced at a few instances that could be easily seen as discrete propagating structures in either direction. However, these signatures are not always visible, which may be due to the limitations of the visual identification, line-of-sight effects, or the geometry of the current sheet. The nature of plasmoids as seen from the height-time plot is also similar to that generated in the MHD simulation by Guidoni et al. (2016).
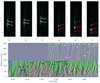 |
Fig. 4. Top panel: plasmoids identified in radial filtered difference images of AIA 131 Å along the current sheet. The outward- and downward-moving plasmoids are shown from panels a to c and d to f encircled in white and red, respectively. Bottom panel: height-time plot corresponding to Fig. 1, with AIA FOV up to ∼150 Mm, and K-Cor beyond it. The ridges corresponding to the identified blobs are marked by dashed lines in black and red, respectively, in AIA FOV, and in white within K-Cor FOV. The serial numbers of the plasmoids in the top panel have their corresponding ridges in the bottom height-time plot. An animation is available online for this figure. |
Similarly to the identification of plasmoids in EUV, we identified them as discrete elongated structures in the running difference images with intensity scaling of K-Cor and LASCO/C2 as shown in Fig. 5. For this pass band of observation, only upward-moving plasmoids were identified. It may be because these plasmoids are smaller and form at lower heights, which are unresolved by these instruments. An animation available in the online version of Fig. 5 shows the identified plasmoids in the LASCO/C2 FOV. In the difference images, we can see that the plasmoids are distinctly visible at the location where the current sheet is seen. We would like to mention here that K-Cor, being a ground-based coronagraph, suffers from atmospheric contribution, hence not all the plasmoids could be tracked in successive frames like those for the AIA and LASCO images. We recorded plasmoids after their first appearance in AIA 131 Å and LASCO/C2 images. In K-Cor images, the first appearance of most of the plasmoids were identified between 1.2 and 1.5 R⊙, where they can be identified as moving structures. This is due to the lower contrast of the plasmoids with respect to the background, and their bigger size, which is probably due to the falling density and magnetic field of the ambient medium with radial distance. This points towards the fact that the disconnection point must be lower than 1.2 R⊙. This also suggests that the downward-moving plasmoids could not be identified in KCor images as they formed at heights lower than 1.2 R⊙, which has been mostly difficult to observe in these images due to limited resolution and saturation close to the flaring region.
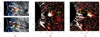 |
Fig. 5. Identification of plasmoids in successive frames of white-light coronagraph images: (a) in K-Cor, difference image plasmoids are marked with yellow contours; (b) and (c) in LASCO/C2, difference image of the location of identified blobs are pointed out with yellow arrows. An animation is available online for this figure. |
Upon inspection of AIA 131 Å images, we found that there were 20 downward-moving plasmoids and 16 upward-moving plasmoids. On the other hand, 24 upward-moving plasmoids were identified from K-Cor images in the inner corona for the same time period, whereas using LASCO/C2 images, we found 17 plasmoids moving to the outer corona for an extended period up to 20:00 UT. The discrepancy in the lower number of upward-moving blobs in AIA FOV may be due to the limitation in the manual identification, as most of these were observed toward the outer region where the signal to noise becomes relatively low. We also recorded the position of these plasmoids in successive images of AIA, K-Cor, and LASCO/C2 images to estimate their kinematic properties.
3.3. Distribution of plasmoids
3.3.1. Size distribution
We noted the length of major and minor axes of the plasmoids when they first appeared in the FOV, assuming that they possessed near-elliptical shapes. The widths of the plasmoids were then estimated as an average of these two dimensions. Figure 6 shows the size distribution of plasmoids identified in AIA 131 Å images: the top panel shows the average width, and the bottom panel the calculated area of plasmoids considering ellipse-like shape. The two colors show the distribution of upward- and downward-moving plasmoids, respectively. We find that the upward-moving plasmoids show widths ranging from 4 to 8 Mm, with a maximum number of plasmoids (10 out of 16) having widths in the range of 4−6 Mm. The average width of these plasmoids is 5.65 Mm, with a median value of 5.28 Mm. On the other hand, the downward-moving plasmoids have distributions from 2 to 10 Mm, and maximum plasmoids (14 out of 20) have widths in the range of 4−6 Mm. These plasmoids have an average width of 5.92 Mm and a median width of 5.65 Mm. The area distribution of these plasmoids as shown in the lower panel of Fig. 6 shows a wide range of the measured area. The area of upward-moving plasmoids ranges from 10 to 50 Mm2, with average and median areas of 23.93 and 21.29 Mm2, respectively. The downward-moving plasmoids showed a larger area range from 10 to 80 Mm2, with an average area of 25.89 Mm2 and a median of 22.75 Mm2. This shows that both the upward- and downward-moving plasmoids show similar size distributions when first identified in AIA FOV. The small differences may be due to the limitation and subjectivity of the visual inspection.
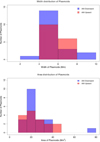 |
Fig. 6. Histogram of size distribution of the blobs identified in AIA 131 Å pass-band images. Top: width distribution of blobs. Bottom: area distribution of blobs. |
The width and area distributions of the plasmoids identified in AIA FOV appear to show a power law with a cut-off, as can be seen from Fig. 6. This cut-off may be due to the limited resolution of the AIA instrument to observe the smallest plasmoid, followed by manual subjectivity. Therefore, we analyzed the overall size distribution of plasmoids from the inner to outer corona, combining the information about plasmoid width observed in AIA 131 Å, K-Cor, and LASCO/C2 (as shown in Fig. 7). The bin corresponding to AIA includes all the upward- and downward-moving plasmoids with mean widths of 5.8 Mm. The plasmoids observed in K-Cor images have widths from 30 to 150 Mm, with an average width of 64 Mm, and they have a median width of 54 Mm. Furthermore, LASCO/C2 observations show a wider range of observed widths. The plasmoids had widths ranging from 320 to 750 Mm, with average and median widths of 510 and 456 Mm, respectively. It can be seen from Fig. 7 that the size of plasmoids increases from the inner to outer corona. It was noticed that the average width of plasmoids increases by ∼11 times when they evolve from AIA to K-Cor FOV, which further increases by ∼8 times when they reach outer corona in LASCO/C2 FOV. It turns out that the plasmoids show a heavy-tail distribution of their sizes when the three instrument observations are combined. We fit the size distribution by a power law with maximum likelihood (Clauset et al. 2009) giving the relation
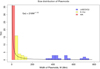 |
Fig. 7. Width distribution of plasmoids identified in AIA, K-Cor, and LASCO C2 images. The horizontal axis is the measured width when they are first identified in the FOV, while the vertical axis is the number of plasmoids corresponding to each bin. The black solid curve is the power-law fit to represent the distribution. |
where f(W) is the number of plasmoids with width W. Guo et al. (2013) used only LASCO/C2 images to observe a dip in the size distribution of plasmoids below 50 Mm, extending the possibility of missing the smaller ones by visual inspection. However, combining the observations from the inner to outer corona, we find that the size distribution of plasmoids formed during the reconnection process follows a single power-law distribution in small- as well as large-scale regimes, which was also proposed by their simulation. This is the first observational evidence in support of this model representing the size distribution of plasmoids by a single power law.
3.3.2. Speed distribution
We tracked the blobs in subsequent images and recorded their positions. Most plasmoids could be identified in at least two successive images. We were able to derive the average speed of the plasmoids observed in EUV as well as white-light images. Figure 8 shows the distribution of average speed for all the plasmoids that could be tracked. We found that the downward-moving plasmoids identified in AIA 131 Å images had speeds ranging from 70 to 425 km s−1, with an average speed of 272 km s−1, whereas the upward-moving plasmoids in the same FOV had a speed range of 30−400 km s−1 and a 191 km s−1 mean. It can also be seen from Fig. 8 that for both upward- and downward-moving plasmoids, most of the plasmoids fall in the speed range of 200−400 km s−1. The upward-moving plasmoids were difficult to track in K-Cor images due to poor signal to noise ratio (S/N). The NRGF-processed K-Cor images performed better in the tracking of plasmoids at heights from 1.2 to 2 R⊙ with a lower cadence of two minutes, compared to the 15 s of the prior. The plasmoids moved upwards at speeds ranging from 320 to 1360 km s−1, with an average speed of 671 km s−1. Beyond 2 R⊙, the plasmoids were tracked in LASCO/C2 FOV, where they traveled at high speeds of 740 to 1800 km s−1. In the outer corona, the plasmoids showed an average speed of ∼1080 km s−1. The average speed of upward-moving plasmoids show an increase by ∼3.5 times when moving from AIA to K-Cor FOV, which further increases by ∼1.5 times on reaching the outer corona. This implies that plasmoids accelerated when propagating outward. The observed speed range for downward-moving plasmoids is ≈7−40% Alfvén speed in the inner corona, taken as ∼1000 km s−1 and implying their sub-Alfvénic nature. On the other hand, upward-moving plasmoids show speeds ranging from 30 to more than 1500 km s−1 from the inner to the outer corona. The wide distribution of speeds for upward-moving plasmoids suggests that they become super-Alfvénic when propagating outward. Also, the Alfvén speed decreases when moving farther away from the Sun. This is also observational evidence supporting the resistive MHD numerical simulation by Bárta et al. (2008), and Forbes et al. (2018) for the kinematics of plasmoids after magnetic reconnection.
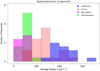 |
Fig. 8. Speed distribution of all plasmoids observed from inner to outer corona. Different colors represent observations from different instruments used for this study. |
3.4. Evolution of plasmoids
Figure 9 shows the relation between the measured width of the plasmoids with their average speed. The region that is ∼200−400 Mm in size corresponds to a lack of observations in K-Cor FOV and greater heights due to poor S/N. We found that when plasmoids evolve and propagate to the outer corona, they obey a power law with the relation
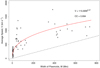 |
Fig. 9. Relation between width and average speed of plasmoids. The red line represents the power law associated with the plasmoid width and average speed. A good correlation with a correlation coefficient (CC) of 0.69 is obtained. The dashed line is 1:1. |
where V and W are the average speed and width of the plasmoids. The plot shows a scatter with ∼69% correlation between the two quantities. This implies that the average speed of the plasmoids is closely related to their size. However, this relation is valid only to describe the accelerating phase of plasmoid evolution. As the plasmoid intensity reduced in the outer corona, we could not track them further in LASCO/C3 FOV to find out if there is any signature of deceleration later upon propagation. This limits Eq. (2) to explaining their evolution characteristic with increasing speeds only.
In the scenario for the downward-moving plasmoids, we also found a variation in speed during their propagation. For 12 out of 20 downward-moving plasmoids that could be tracked in at least three consecutive frames, we could determine their acceleration. It can be seen from Fig. 10 that the acceleration of these plasmoids varied from −11 km s−2 to more than 8 km s−2. It was found that a significant fraction (6 out of 12) accelerated when moving downward, whereas two moved with approximately no acceleration. The remaining ones showed deceleration. It was predicted by Forbes et al. (2018) that the downward moving plasmoids should show acceleration. However, due to the limited observations, this could not be verified in earlier studies (Savage et al. 2010). Such observations combined with modeling may add to our knowledge about the true nature of magnetic reconnection.
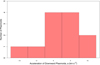 |
Fig. 10. Distribution of downward-moving plasmoid acceleration observed in AIA 131 Å images. |
3.5. Identification of X-point
We plotted the locations of the first appearance of the upward- and downward-moving plasmoids in AIA 131 Å images as shown in Fig. 11. The points shown in blue mark the initial positions of downward-moving plasmoids, whereas red represents upward-moving plasmoids. The red points are spread across all the heights along the current sheet in AIA FOV. The middle panel of Fig. 4 also shows the presence of the movements in opposite directions appearing as ridges in the height-time plot. It should be noted from Fig. 11 that no downward-moving plasmoids appear higher than ∼1110 arcsec, corresponding to a height of ≈0.15 R⊙ from the solar surface. This suggests that the region around 1.15 R⊙ is related to the formation of downward blobs. This region is speculated to be the primary disconnection (X-point) region in the current sheet, where reconnection occurred and the flow pairs generated. Forbes et al. (2018) showed that during a reconnection, multiple neutral points may form, but a single stagnation point may govern the dynamics of the current sheet. We speculate the stagnation and the primary disconnection point to be located at ≈1.15 R⊙. It should also be noted that this point is closer to the post-flare loop top, which was identified to be around ∼1.03 R⊙. This height, unlike the models of Lin & Forbes (2000) and Reeves & Forbes (2005), does not lie at the center of the current sheet length, but closer to its lower tip. This estimate is within the range of neutral points identified using height-time plots for the current sheet associated with this event as reported in recent studies (Cheng et al. 2018; Yu et al. 2020). A null-point height of 1.25 R⊙ was reported in Savage et al. (2010) from the identified SADs. A failed attempt to identify a mean null-point height of 1.2 R⊙ was made to explain the origin of post-CME blobs (Schanche et al. 2016). They extended the possibility of formation of blobs at greater heights than AIA FOV. Chae et al. (2017) estimated a height of 1.5 R⊙ for the formation of upward-moving blobs in their study.
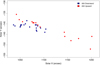 |
Fig. 11. Location of blobs identified manually from AIA 131 Å pass-band images. Red corresponds to the position of upward-moving plasmoids, whereas blue represents the downward-moving ones. |
4. Summary and discussions
Magnetic reconnection plays a major role in small- and large-scale transients observed in the solar atmosphere. In this work, we studied the statistical properties of plasmoids observed in the current sheet at the western solar limb after a fast CME on 2017 September 10. Due to its visibility in multiple pass bands for a long duration, we attempted to formulate the evolution of plasmoids during the reconnection process. In this work, we derived the Alfvén Mach number by taking the width-to-length ratio, and it turns out to be in the range of 0.018−0.35, which is sufficient to lead to an eruption, as proposed by Lin & Forbes (2000), and to the formation of plasmoids (Vršnak et al. 2003) during a fast reconnection process. It is observed that the reconnection was accompanied by the plasma blobs along the current sheet in upward and downward directions in the AIA 131 Å pass band, and in upward-moving plasmoids in white-light coronagraph images of K-Cor and LASCO.
We visually identified and tracked these blobs as the bright structures moving along the current sheet in the time-series images and developed a statistics. There were 20 downward-moving and 16 upward-moving plasma blobs observed in the AIA 131 Å images. In the K-Cor images, 24 upward-moving blobs were observed, whereas 17 upward-moving plasmoids were identified in LASCO/C2 images. We could not identify any downward-moving plasmoids in white-light coronagraph images, suggesting that they formed at lower heights corresponding only to the AIA FOV. Lee et al. (2020) reported the identification of 34 plasma blobs in the K-Cor FOV, whereas four were identified in LASCO/C2 FOV associated with the current sheet. The difference in the number could be addressed as the manual subjectivity in identification. We would like to mention here that some of the bright propagating bidirectional outflows reported in Yu et al. (2020) could be blobs, as these signatures have been identified in our study along with that of Lee et al. (2020). It is likely that both blobs and flows are produced during the reconnection and co-exist, which could make them difficult to distinguish in some instances.
The size distribution of the plasmoids observed in AIA, K-Cor, and the LASCO-C2 FOV reveals that it follows a power-law distribution as proposed using a resistive-MHD simulation by Guo et al. (2013) and differing from the one found by McKenzie & Savage (2011) for SADs. On fitting the power-law to the distribution to the observed widths (W) of plasmoids, we found a decreasing function: f(W) = 218W−1.12. This is the first observational study to support the power-law distribution of plasmoid widths. This also suggests that the lower limit is determined by the instrument, and hence earlier observations could not provide an agreement. The plasmoids, both upward and downward moving, had an average width range of ∼6 Mm in the AIA FOV when they had just formed. This range increases to ∼64 Mm in white-light K-Cor images, which further evolves to ∼510 Mm in the outer corona in the LASCO/C2 FOV. The wide range of sizes hints at the tearing of the current sheet over scales of a few Mm to hundreds of Mm. We identify that these blobs are formed in the AIA and KCor FOV, which evolved and grew in size moving out to the LASCO/C2 FOV. The lower number of blobs in the LASCO FOV compared to the KCor images also suggests the possibility of the merging of blobs to form bigger blobs. The estimated size is larger than the estimations presented in Lee et al. (2020) corresponding to ∼14 to 42 Mm average lateral widths in K-Cor FOV and ∼175 Mm in the LASCO/C2 FOV. If the average radial and lateral widths are considered in this study, the estimates of average size becomes ∼30 Mm and ∼330 Mm for the KCor and LASCO/C2 FOV, respectively. The differences could arise due to the variations in the visual identification of the blobs.
The region separating the upward- and downward-moving blobs was identified at ≈1.15 R⊙. This region is regarded as the principal disconnection region where the reconnection is the fastest. Forbes et al. (2018) suggested that there can be multiple neutral points in a current sheet, but a primary stagnation point will be responsible for the dynamics of the current sheet. Therefore, the height determined in this work can be regarded as this primary stagnation point. As this point lies closer to the post-flare loop top, this also confirms that the primary disconnection and stagnation points lie closer to the lower tip of the current sheet. Due to observation difficulties, the search of such region was not successful when plasma blobs identified in LASCO/C2 were tracked back in the AIA FOV (Schanche et al. 2016). A previous study by Savage et al. (2010) suggests the existence of such a region by tracking the downflows of SADs. For the current sheet formed on 2017 September 10, after their formation plasmoids are found to be moving at an average speed of 272 km s−1 toward the Sun, and at 191 km s−1 in the other direction. When the upward-moving plasmoids had traversed from the AIA FOV to ∼1.2 to 2 R⊙ and were tracked in K-Cor images, the average speed increased to 671 km s−1, which further increased to ∼1080 km s−1 beyond 2 R⊙ in the LASCO FOV. This suggests that the plasmoids had sufficient energy to accelerate to super-Alfvénic speeds as they reached outer corona. This differs from the earlier result based on a limited observation stating that the upward-moving plasmoids do not show significant change in speed (Savage et al. 2010). On the other hand, speed ranges of ∼38 to 945 km s−1 and 767 to 787 km s−1 were measured for the blobs in K-Cor and the LASCO/C2 FOV, respectively, by Lee et al. (2020). The downward-moving plasmoids do not show high speeds as they merge with the underlying loops, giving them less time to accelerate, unlike the upward-moving ones. However, these downward-directed plasmoids show an acceleration ranging from −11 km s−2 to more than 8 km s−2. The acceleration of the bidirectional plasmoids near the neutral point provides an important implication in the determination of the diffusion region in the current sheet (Forbes et al. 2018). The speed distribution also satisfies the kinematic properties of upward- and downward-moving plasmoids proposed by Bárta et al. (2008) and Forbes et al. (2018). These plasmoids could not be tracked at farther distances due to their decreasing radial intensity in the outer corona. As a result, it is still unclear up to what distance after their formation they show acceleration.
It can be seen from Figs. 7 and 8 that the sizes of the plasmoids and their speeds are escalated when they reach the outer corona. We tried to relate the two observables and found a good correlation of ∼69% between them. We establish an empirical relation characterizing the two quantities as V = 115.69W0.37. The signature of the expansion of plasmoids and the increase in average speed can be clearly noticed in Fig. 9. This relation, based on an observational study, is a step toward constraining the numerical simulation and helping us to understand the formation and evolution of plasmoids and their role in the reconnection process.
The difficulty in tracking the blobs from origin to farther out in the corona was also identified by Schanche et al. (2016). The limited availability of a white-light coronagraph like K-Cor is also subjected to atmospheric conditions, which limits these types of studies. This scenario will be improved in future if a similar event is observed by instruments like METIS on-board the Solar Orbiter (Müller et al. 2020), VELC on Aditya-L1 (Seetha & Megala 2017), and ASPIICS of PROBA-3 (Renotte et al. 2014), as they observe below 3 R⊙. It is worthwhile to mention that the limit of white-light observations will be pushed forward with the availability of high-resolution images taken at high cadence and with a good S/N by VELC (Raghavendra Prasad et al. 2017) and ASPIICS. It will be helpful to identify the different phases of plasmoid propagation and kinematic properties (Bárta et al. 2008; Forbes et al. 2018). In future, the availability of magnetic field measurements in the inner corona using the VELC payload of Aditya-L1 (Kasiviswanathan 2018) will also help us establish the scales of magnetic field in the plasmoids (Huang & Bhattacharjee 2012). This will enable us to better understand the plasmoid instability, and hence the fast reconnection observed in the solar atmosphere.
Movies
Movie of Fig. 1 Access here
Movie of Fig. 4 Access here
Movie of Fig. 5 Access here
Acknowledgments
We thank the anonymous referee for the valuable comments. V.P. is supported by the Spanish Ministerio de Ciencia, Innovación y Universidades through project PGC2018-102108-B-I00 and FEDER funds. V.P. was further supported by the GOA-2015-014 (KU Leuven) and the European Research Council (ERC) under the European Union’s Horizon 2020 research and innovation programme (grant agreement No 724326). V.P. acknowledge support from the International Space Science Institute (ISSI), Bern, Switzerland to the International Team 413 “Large-Amplitude Oscillations as a Probe of Quiescent and Erupting Solar Prominences” (P.I. M. Luna) which enabled thoughtful discussions with Dr. Judith Karpen. K.C. is supported by the Research Council of Norway through its Centres of Excellence scheme (project number 262622). We also thank Dr. Daniel B. Seaton, Bibhuti Kumar Jha, and Satabdwa Majumdar for the discussions and suggestions. We acknowledge NASA/SDO team to make AIA data for open access. SDO is a mission for NASA’s Living With a Star (LWS) program. SOHO is a project of international collaboration between ESA and NASA. We also thank Mauna Loa Solar Observatory located at High Altitude Observatory for making K-Cor data available.
References
- Asai, A., Yokoyama, T., Shimojo, M., & Shibata, K. 2004, ApJ, 605, L77 [NASA ADS] [CrossRef] [Google Scholar]
- Bárta, M., Vršnak, B., & Karlický, M. 2008, A&A, 477, 649 [NASA ADS] [CrossRef] [EDP Sciences] [Google Scholar]
- Bemporad, A., Poletto, G., Suess, S. T., et al. 2006, ApJ, 638, 1110 [Google Scholar]
- Bhattacharjee, A., Huang, Y.-M., Yang, H., & Rogers, B. 2009, Phys. Plasmas, 16, 112102 [NASA ADS] [CrossRef] [Google Scholar]
- Brueckner, G. E., Howard, R. A., Koomen, M. J., et al. 1995, Sol. Phys., 162, 357 [NASA ADS] [CrossRef] [Google Scholar]
- Carmichael, H. 1964, in A Process for Flares, ed. W. N. Hess, 50, 451 [Google Scholar]
- Chae, J., Cho, K., Kwon, R.-Y., & Lim, E.-K. 2017, ApJ, 841, 49 [CrossRef] [Google Scholar]
- Cheng, X., Li, Y., Wan, L. F., et al. 2018, ApJ, 866, 64 [NASA ADS] [CrossRef] [Google Scholar]
- Ciaravella, A., & Raymond, J. C. 2008, ApJ, 686, 1372 [NASA ADS] [CrossRef] [Google Scholar]
- Clauset, A., Shalizi, C. R., & Newman, M. E. J. 2009, SIAM Rev., 51, 661 [NASA ADS] [CrossRef] [MathSciNet] [Google Scholar]
- de Wijn, A. G., Burkepile, J. T., Tomczyk, S., et al. 2012, in Ground-based and Airborne Telescopes IV, Proc. SPIE, 8444, 84443N [CrossRef] [Google Scholar]
- Forbes, T. G., Seaton, D. B., & Reeves, K. K. 2018, ApJ, 858, 70 [CrossRef] [Google Scholar]
- French, R. J., Judge, P. G., Matthews, S. A., & van Driel-Gesztelyi, L. 2019, ApJ, 887, L34 [CrossRef] [Google Scholar]
- Gary, D. E., Chen, B., Dennis, B. R., et al. 2018, ApJ, 863, 83 [CrossRef] [Google Scholar]
- Gopalswamy, N., Yashiro, S., Mäkelä, P., et al. 2018, ApJ, 863, L39 [CrossRef] [Google Scholar]
- Guidoni, S. E., DeVore, C. R., Karpen, J. T., & Lynch, B. J. 2016, ApJ, 820, 60 [NASA ADS] [CrossRef] [Google Scholar]
- Guo, L.-J., Bhattacharjee, A., & Huang, Y.-M. 2013, ApJ, 771, L14 [CrossRef] [Google Scholar]
- Hayes, L. A., Gallagher, P. T., Dennis, B. R., et al. 2019, ApJ, 875, 33 [Google Scholar]
- Hirayama, T. 1974, Sol. Phys., 34, 323 [NASA ADS] [CrossRef] [Google Scholar]
- Howard, R. A., Moses, J. D., Socker, D. G., Dere, K. P., & Cook, J. W. 2002, Adv. Space Res., 29, 2017 [NASA ADS] [CrossRef] [Google Scholar]
- Huang, Y.-M., & Bhattacharjee, A. 2010, Phys. Plasmas, 17, 062104 [NASA ADS] [CrossRef] [Google Scholar]
- Huang, Y.-M., & Bhattacharjee, A. 2012, Phys. Rev. Lett., 109, 265002 [NASA ADS] [CrossRef] [Google Scholar]
- Hundhausen, A. J., Sawyer, C. B., House, L., Illing, R. M. E., & Wagner, W. J. 1984, J. Geophys. Res., 89, 2639 [NASA ADS] [CrossRef] [Google Scholar]
- Jelínek, P., Karlický, M., Van Doorsselaere, T., & Bárta, M. 2017, ApJ, 847, 98 [NASA ADS] [CrossRef] [Google Scholar]
- Kasiviswanathan, S. 2018, 42nd COSPAR Scientific Assembly, 42, E2.3–16–18 [Google Scholar]
- Kliem, B., Karlický, M., & Benz, A. O. 2000, A&A, 360, 715 [NASA ADS] [Google Scholar]
- Ko, Y.-K., Raymond, J. C., Lin, J., et al. 2003, ApJ, 594, 1068 [NASA ADS] [CrossRef] [Google Scholar]
- Kopp, R. A., & Pneuman, G. W. 1976, Sol. Phys., 50, 85 [NASA ADS] [CrossRef] [Google Scholar]
- Kumar, P., & Cho, K.-S. 2013, A&A, 557, A115 [NASA ADS] [CrossRef] [EDP Sciences] [Google Scholar]
- Lee, J.-O., Cho, K.-S., Lee, K.-S., et al. 2020, ApJ, 892, 129 [CrossRef] [Google Scholar]
- Lemen, J. R., Title, A. M., Akin, D. J., et al. 2012, Sol. Phys., 275, 17 [Google Scholar]
- Lin, J. 2002, Chin. J. Astron. Astrophys., 2, 539 [NASA ADS] [CrossRef] [Google Scholar]
- Lin, J., & Forbes, T. G. 2000, J. Geophys. Res., 105, 2375 [NASA ADS] [CrossRef] [Google Scholar]
- Lin, J., Ko, Y.-K., Sui, L., et al. 2005, ApJ, 622, 1251 [NASA ADS] [CrossRef] [Google Scholar]
- Longcope, D., Unverferth, J., Klein, C., McCarthy, M., & Priest, E. 2018, ApJ, 868, 148 [CrossRef] [Google Scholar]
- McKenzie, D. E., & Savage, S. L. 2011, ApJ, 735, L6 [CrossRef] [Google Scholar]
- Moon, Y.-J., Choe, G. S., Wang, H., et al. 2002, ApJ, 581, 694 [Google Scholar]
- Morgan, H., Habbal, S. R., & Woo, R. 2006, Sol. Phys., 236, 263 [NASA ADS] [CrossRef] [Google Scholar]
- Müller, D., St. Cyr, O. C., Zouganelis, I., et al. 2020, A&A, 642, A1 [CrossRef] [EDP Sciences] [Google Scholar]
- Ning, Z., Wu, H., Xu, F., & Meng, X. 2007, Sol. Phys., 241, 77 [NASA ADS] [CrossRef] [Google Scholar]
- Parker, E. N. 1957, J. Geophys. Res. (1896–1977), 62, 509 [NASA ADS] [CrossRef] [Google Scholar]
- Petschek, H. E. 1964, in Magnetic Field Annihilation, ed. W. N. Hess, 50, 425 [Google Scholar]
- Polito, V., Dudík, J., Kašparová, J., et al. 2018, ApJ, 864, 63 [NASA ADS] [CrossRef] [Google Scholar]
- Raghavendra Prasad, B., Banerjee, D., Singh, J., et al. 2017, Curr. Sci., 113, 613 [CrossRef] [Google Scholar]
- Reeves, K. K., & Forbes, T. G. 2005, ApJ, 630, 1133 [NASA ADS] [CrossRef] [Google Scholar]
- Renotte, E., Baston, E. C., Bemporad, A., et al. 2014, in Space Telescopes and Instrumentation 2014: Optical, Infrared, and Millimeter Wave, Proc. SPIE, 9143, 91432M [CrossRef] [Google Scholar]
- Riley, P., Lionello, R., Mikić, Z., et al. 2007, ApJ, 655, 591 [NASA ADS] [CrossRef] [Google Scholar]
- Savage, S. L., McKenzie, D. E., Reeves, K. K., Forbes, T. G., & Longcope, D. W. 2010, ApJ, 722, 329 [NASA ADS] [CrossRef] [Google Scholar]
- Schanche, N. E., Reeves, K. K., & Webb, D. F. 2016, ApJ, 831, 47 [NASA ADS] [CrossRef] [Google Scholar]
- Seaton, D. B., & Forbes, T. G. 2009, ApJ, 701, 348 [CrossRef] [Google Scholar]
- Seetha, S., & Megala, S. 2017, Curr. Sci., 113, 610 [CrossRef] [Google Scholar]
- Shibata, K. 1996, Adv. Space Res., 17, 9 [NASA ADS] [CrossRef] [Google Scholar]
- Shibata, K. 1997, in Fifth SOHO Workshop: The Corona and Solar Wind Near Minimum Activity, ed. A. Wilson, ESA Spec. Publ., 404, 103 [NASA ADS] [Google Scholar]
- Shibata, K., & Tanuma, S. 2001, Earth Planets Space, 53, 473 [NASA ADS] [CrossRef] [Google Scholar]
- Sittler, E. C., Jr., & Guhathakurta, M. 1999, ApJ, 523, 812 [NASA ADS] [CrossRef] [Google Scholar]
- Srivastava, A. K., Mishra, S. K., Jelínek, P., et al. 2019, ApJ, 887, 137 [CrossRef] [Google Scholar]
- Sturrock, P. A. 1966, Nature, 211, 695 [NASA ADS] [CrossRef] [Google Scholar]
- Sweet, P. A. 1958, IAU Symp., 6, 123 [Google Scholar]
- Takasao, S., Asai, A., Isobe, H., & Shibata, K. 2012, ApJ, 745, L6 [NASA ADS] [CrossRef] [Google Scholar]
- Veronig, A. M., Podladchikova, T., Dissauer, K., et al. 2018, ApJ, 868, 107 [Google Scholar]
- Vršnak, B., Klein, K.-L., Warmuth, A., Otruba, W., & Skender, M. 2003, Sol. Phys., 214, 325 [NASA ADS] [CrossRef] [Google Scholar]
- Warren, H. P., Brooks, D. H., Ugarte-Urra, I., et al. 2018, ApJ, 854, 122 [CrossRef] [Google Scholar]
- Webb, D. F., & Vourlidas, A. 2016, Sol. Phys., 291, 3725 [NASA ADS] [CrossRef] [Google Scholar]
- Yan, X. L., Yang, L. H., Xue, Z. K., et al. 2018, ApJ, 853, L18 [NASA ADS] [CrossRef] [Google Scholar]
- Yu, S., Chen, B., Reeves, K. K., et al. 2020, ApJ, 900, 17 [CrossRef] [Google Scholar]
All Figures
|
Fig. 1. Context image for the observed current sheet in K-Cor data. Green rectangular box in the top panel corresponds to ROI-A chosen for the analysis in the K-Cor data. The orange box represents the ROI-B chosen in the AIA 131 Å passband data, which is shown in the bottom panel. The red dashed line along the identified current sheet is used for generating a height-time plot (an animation is available online for this figure). |
| In the text | |
|
Fig. 2. Composite image of AIA 193 Å, K-Cor, LASCO-C2, and C3 for 2017 September 10 at 17:05 UT. A close view of the inner FOV is shown in a subsequent image with the length of current sheet shown by the red line. The white rectangular box represents the approximate error in estimating the length of the current sheet. |
| In the text | |
|
Fig. 3. Evolution of estimated Alfvén Mach number (MA) with time using width/length relation of current sheet. The blue points are the MA estimated using AIA 131 Å images for current sheet length measurement, whereas the red ones belong to LASCO images. |
| In the text | |
|
Fig. 4. Top panel: plasmoids identified in radial filtered difference images of AIA 131 Å along the current sheet. The outward- and downward-moving plasmoids are shown from panels a to c and d to f encircled in white and red, respectively. Bottom panel: height-time plot corresponding to Fig. 1, with AIA FOV up to ∼150 Mm, and K-Cor beyond it. The ridges corresponding to the identified blobs are marked by dashed lines in black and red, respectively, in AIA FOV, and in white within K-Cor FOV. The serial numbers of the plasmoids in the top panel have their corresponding ridges in the bottom height-time plot. An animation is available online for this figure. |
| In the text | |
|
Fig. 5. Identification of plasmoids in successive frames of white-light coronagraph images: (a) in K-Cor, difference image plasmoids are marked with yellow contours; (b) and (c) in LASCO/C2, difference image of the location of identified blobs are pointed out with yellow arrows. An animation is available online for this figure. |
| In the text | |
|
Fig. 6. Histogram of size distribution of the blobs identified in AIA 131 Å pass-band images. Top: width distribution of blobs. Bottom: area distribution of blobs. |
| In the text | |
|
Fig. 7. Width distribution of plasmoids identified in AIA, K-Cor, and LASCO C2 images. The horizontal axis is the measured width when they are first identified in the FOV, while the vertical axis is the number of plasmoids corresponding to each bin. The black solid curve is the power-law fit to represent the distribution. |
| In the text | |
|
Fig. 8. Speed distribution of all plasmoids observed from inner to outer corona. Different colors represent observations from different instruments used for this study. |
| In the text | |
|
Fig. 9. Relation between width and average speed of plasmoids. The red line represents the power law associated with the plasmoid width and average speed. A good correlation with a correlation coefficient (CC) of 0.69 is obtained. The dashed line is 1:1. |
| In the text | |
|
Fig. 10. Distribution of downward-moving plasmoid acceleration observed in AIA 131 Å images. |
| In the text | |
|
Fig. 11. Location of blobs identified manually from AIA 131 Å pass-band images. Red corresponds to the position of upward-moving plasmoids, whereas blue represents the downward-moving ones. |
| In the text | |
Current usage metrics show cumulative count of Article Views (full-text article views including HTML views, PDF and ePub downloads, according to the available data) and Abstracts Views on Vision4Press platform.
Data correspond to usage on the plateform after 2015. The current usage metrics is available 48-96 hours after online publication and is updated daily on week days.
Initial download of the metrics may take a while.