Fig. 4.
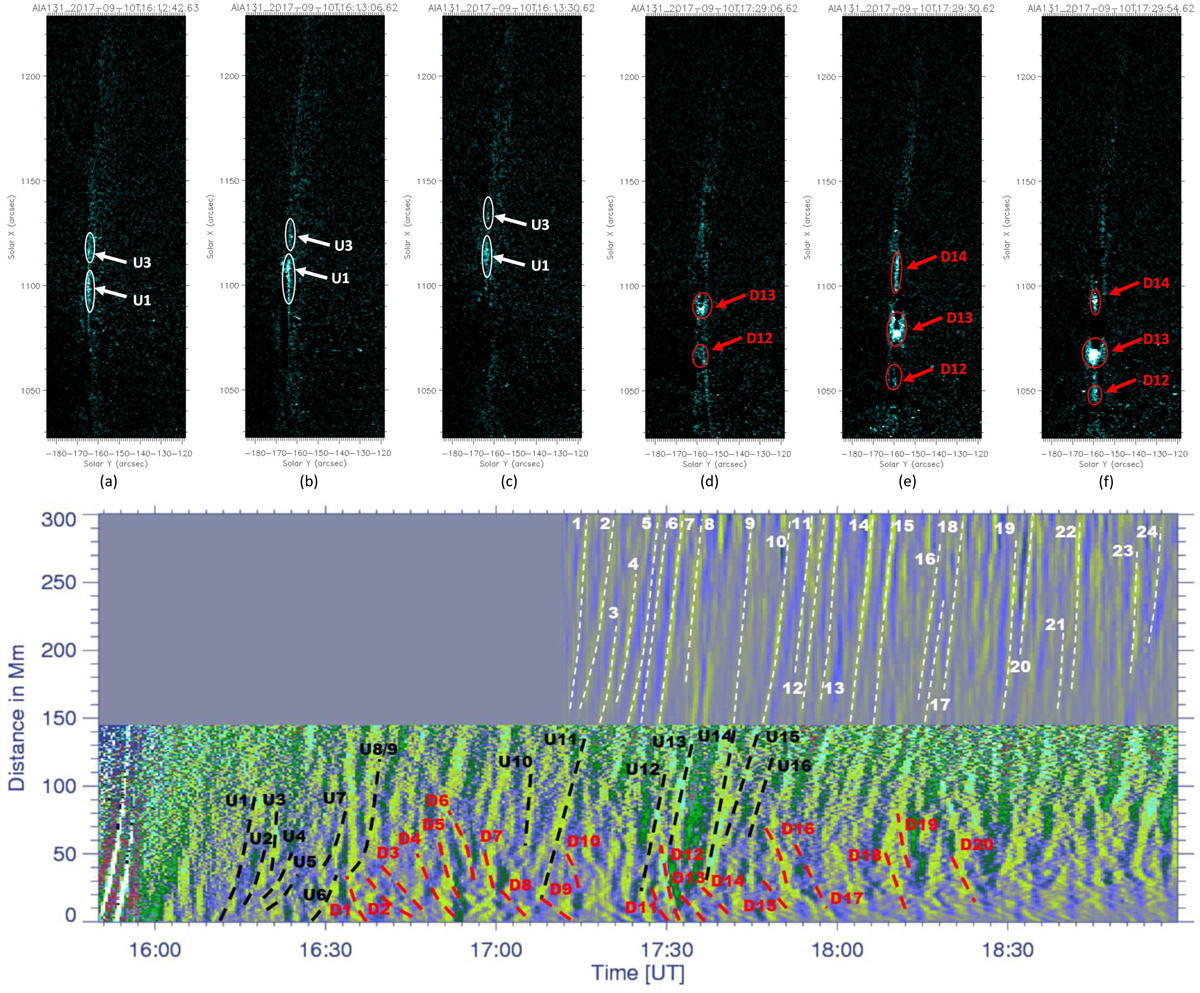
Top panel: plasmoids identified in radial filtered difference images of AIA 131 Å along the current sheet. The outward- and downward-moving plasmoids are shown from panels a to c and d to f encircled in white and red, respectively. Bottom panel: height-time plot corresponding to Fig. 1, with AIA FOV up to ∼150 Mm, and K-Cor beyond it. The ridges corresponding to the identified blobs are marked by dashed lines in black and red, respectively, in AIA FOV, and in white within K-Cor FOV. The serial numbers of the plasmoids in the top panel have their corresponding ridges in the bottom height-time plot. An animation is available online for this figure.
Current usage metrics show cumulative count of Article Views (full-text article views including HTML views, PDF and ePub downloads, according to the available data) and Abstracts Views on Vision4Press platform.
Data correspond to usage on the plateform after 2015. The current usage metrics is available 48-96 hours after online publication and is updated daily on week days.
Initial download of the metrics may take a while.