Free Access
Fig. 7.
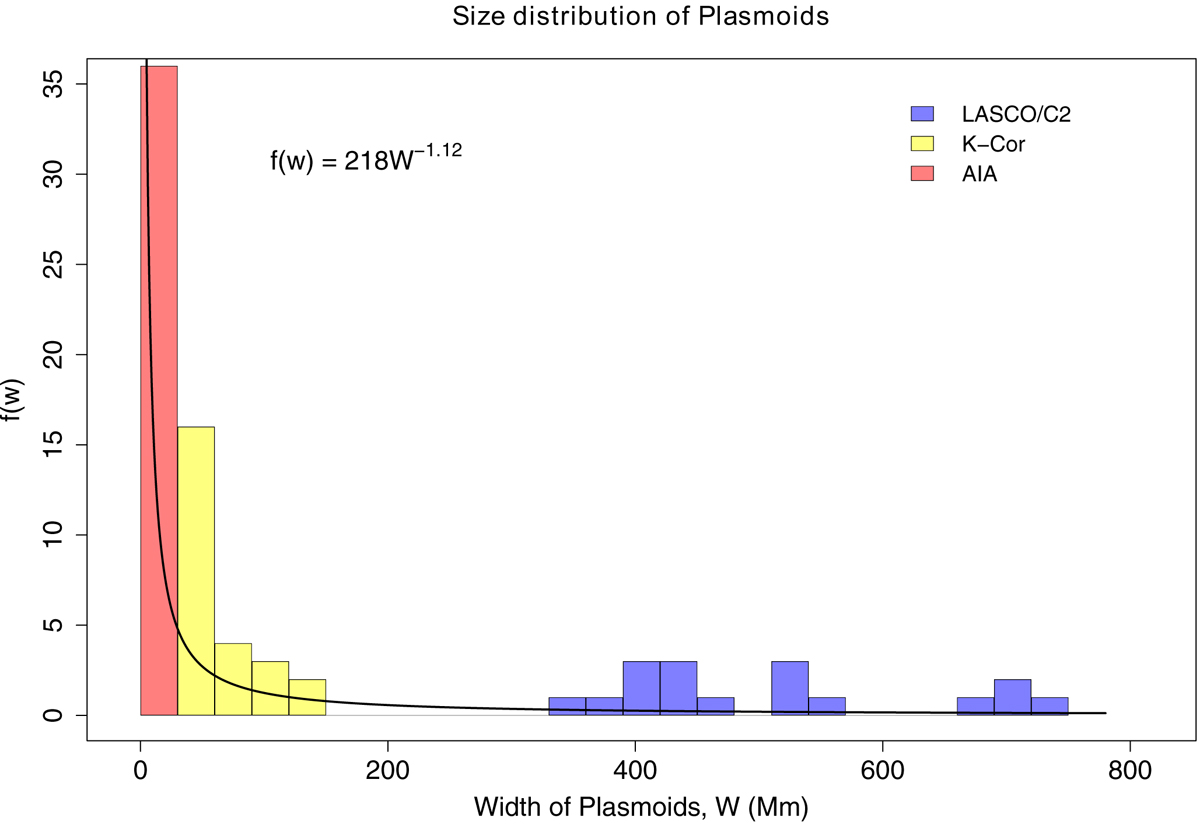
Width distribution of plasmoids identified in AIA, K-Cor, and LASCO C2 images. The horizontal axis is the measured width when they are first identified in the FOV, while the vertical axis is the number of plasmoids corresponding to each bin. The black solid curve is the power-law fit to represent the distribution.
Current usage metrics show cumulative count of Article Views (full-text article views including HTML views, PDF and ePub downloads, according to the available data) and Abstracts Views on Vision4Press platform.
Data correspond to usage on the plateform after 2015. The current usage metrics is available 48-96 hours after online publication and is updated daily on week days.
Initial download of the metrics may take a while.