Free Access
Fig. 5.
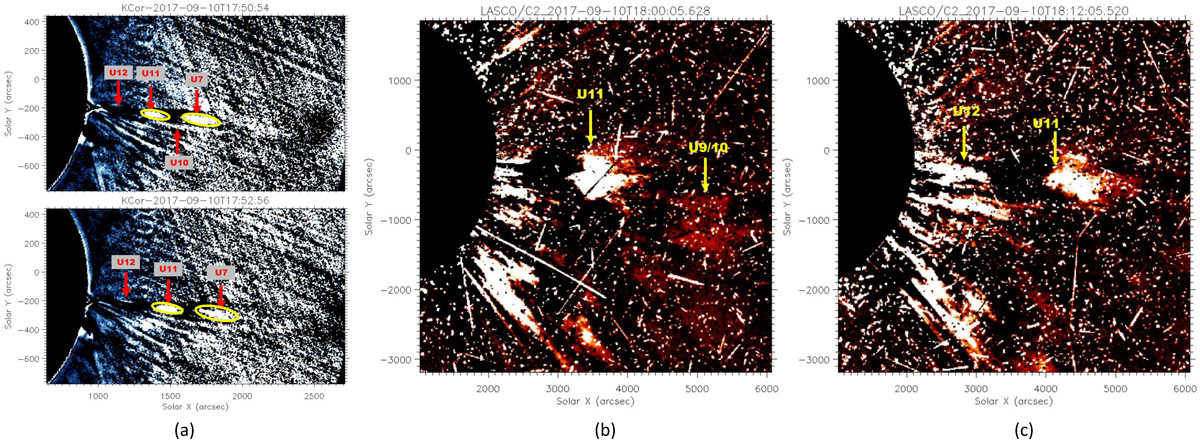
Identification of plasmoids in successive frames of white-light coronagraph images: (a) in K-Cor, difference image plasmoids are marked with yellow contours; (b) and (c) in LASCO/C2, difference image of the location of identified blobs are pointed out with yellow arrows. An animation is available online for this figure.
Current usage metrics show cumulative count of Article Views (full-text article views including HTML views, PDF and ePub downloads, according to the available data) and Abstracts Views on Vision4Press platform.
Data correspond to usage on the plateform after 2015. The current usage metrics is available 48-96 hours after online publication and is updated daily on week days.
Initial download of the metrics may take a while.