| Issue |
A&A
Volume 644, December 2020
|
|
|---|---|---|
| Article Number | A98 | |
| Number of page(s) | 4 | |
| Section | Galactic structure, stellar clusters and populations | |
| DOI | https://doi.org/10.1051/0004-6361/202038993 | |
| Published online | 04 December 2020 | |
Multiple populations of Hβ emission line stars in the Large Magellanic Cloud cluster NGC 1971
1
Instituto Interdisciplinario de Ciencias Básicas (ICB), CONICET-UNCUYO, Padre J. Contreras 1300, M5502JMA Mendoza, Argentina
e-mail: andres.piatti@unc.edu.ar
2
Consejo Nacional de Investigaciones Científicas y Técnicas (CONICET), Godoy Cruz 2290, C1425FQB Buenos Aires, Argentina
Received:
21
July
2020
Accepted:
30
October
2020
We revisited the young Large Magellanic Cloud star cluster NGC 1971 with the aim of providing additional clues to our understanding of its observed extended main-sequence turnoff (eMSTO), a feature commonly seen in young star clusters that has recently been argued to be caused by a real age spread similar to the cluster age (∼160 Myr). We combined accurate Washington and Strömgren photometry of stars with high membership probability to explore the nature of this eMSTO. From different ad hoc defined pseudo-colors, we found that bluer and redder stars distributed throughout the eMSTO do not show any inhomogeneities of light- and heavy-element abundances. These blue and red stars are split into two clearly different groups only when the Washington M magnitudes are employed, which delimites the number of spectral features that cause the appearance of the eMSTO. We speculate that Be stars populate the eMSTO of NGC 1971 because (i) Hβ contributes to the M passband, (ii) Hβ emissions are common features of Be stars, and (iii) the Washington M and T1 magnitudes are tightly correlated; the latter measuring the observed contribution of Hα emission line in Be stars, which is in turn correlated with Hβ emissions. This is the first observational result to our knowledge that indicates that Hβ emissions are the origin of eMSTOs observed in young star clusters. Our results certainly open new possibilities of studying eMSTO from photometric systems with passbands centered at features commonly seen in Be stars.
Key words: techniques: photometric / galaxies: individual: LMC / galaxies: star clusters: general / galaxies: star clusters: individual: NGC 1971
© ESO 2020
1. Introduction
Piatti & Cole (2017) detected an extended main-sequence turnoff (eMSTO) in the young Large Magellanic Cloud (LMC) cluster NGC 1971 (∼160 Myr) using broadband Washington CT1 photometry (Canterna 1976). After considering photometric uncertainties, the presence of binary stars, variations in the overall metallicity, and stellar rotation effects, they concluded that the observed eMSTO could have been caused by a real age spread of ∼170 Myr in addition to the above sources of color dispersion in the cluster color-magnitude diagram (CMD). Because Hα contributes to the Washington T1 passband, the broadness of the C − T1 color range in the CMD of NGC 1971 might be due to Be stars, so that the eMSTO would originate in two populations of slow and fast rotators, respectively. However, the M versus C − M CMD in Piatti & Cole 2017, see their Fig. 4) still shows an eMSTO, thus supporting the idea that the age spread is real. eMSTOs have been commonly seen in star clusters with ages similar to that of NGC 1971, including Magellanic Cloud star clusters (e.g. D’Antona et al. 2017; Milone et al. 2017, 2018; Goudfrooij et al. 2018) and Galactic open clusters (Marino et al. 2018a; Cordoni et al. 2018).
In recent years, stellar rotation has been suggested as a main source for the occurrence of the eMSTO phenomenon in young star clusters. Bastian et al. (2017) found a high fraction of Be stars in the LMC clusters NGC 1850 (∼80 Myr) and NGC 1856 (∼280 Myr), which implies a high fraction of rapidly rotating stars. These Be stars are located toward the redder end of the cluster eMSTOs (see also Milone et al. 2018). Dupree et al. (2017) provided the first spectroscopic evidence that two populations coexist in the LMC cluster NGC 1866 (∼200 Myr), consisting of one younger and slowly rotating and another rapidly rotating group of stars (see also Gossage et al. 2019). The latter exhibit Hα emission lines. Additional spectroscopic evidence was shown by Marino et al. (2018a,2018b see Figs. 2 and 8). We note also that the effects of braking in main-sequence stars might mimic an age spread (D’Antona et al. 2017).
We here revisit NGC 1971 with the aim of providing additional evidence for the possible origin of its eMSTO. In Sect. 2 we present Strömgren photometry (Crawford & Mandwewala 1976) for the cluster field, while in Sect. 3 we analyze light-element abundance variations, which are usually associated with the existence of multiple populations in globular clusters (Marino et al. 2019). We show that Be stars with Hβ emission may have contributed to the M Washington passband and hence to the spread in the C − M color. We note that Be stars in eMSTO clusters have been detected from their emission in Hα; no evidence for other emission features has been reported. Finally, in Sect. 4 we summarize the main conclusions of this work.
2. Strömgren photometric data
We searched the National Optical Astronomy Observatory (NOAO) Science Data Management (SDM) Archives1 for unexploited images in the field of NGC 1971. The observing program SO2008B-0917 (PI: Pietrzyński), carried out with the SOAR Optical Imager (SOI) attached to the 4.1m Southern Astrophysical Research (SOAR) telescope (field of view = 5.25′ × 5.25′, scale = 0.154″ px−1 in binned mode), obtained Strömgren vby images centered on the cluster during the night of January 18, 2009 under excellent image-quality conditions (typical full width at half maximum ∼0.6″). They consist of 3 × 400 s, 3 × 180 s, and 3 × 100 s exposures in the v, b, and y passbands, respectively, at airmass between 1.42 and 1.50. Standard stars were also observed during the night: HD 64, HD 3417, HD 12756, HD 22610, HD 57568, HD 58489, TYC 7583-1622-1, and TYC 8104-969-1 (Hauck & Mermilliod 1998; Paunzen 2015). They were observed twice at a fixed airmass to allow them to be placed in the two different CCDs arrayed by SOI, and thus to monitor their individual responses. We also downloaded calibration frames (zeros and sky and dome flats). We processed the images following the SOI reduction recipes available online2. The LMC cluster NGC 1978 was also observed during the same night, so that we took advantage of the transformation equations fit by Piatti & Bailin (2019), who showed that magnitudes of standard stars placed in each CCD are indistinguishable.
The image-processing packages DAOPHOT, ALLSTAR, DAOMATCH, and DAOMASTER (stand-alone version, Stetson et al. 1990) were employed to obtain point-spread function (PSF) magnitudes and their associated uncertainties. We started by interactively selecting nearly one hundred relatively bright, unsaturated, and well-isolated stars located within the whole image area to construct the corresponding PSF. Nearly 40% of the selected PSF stars were initially chosen to build a preliminary PSF, which was applied to the image in order to clean the whole sample of PSF stars from fainter neighbors. We built the final quadratically spatially-varying PSF for that image from that cleaned PSF star sample, and computed aperture corrections that resulted in the range −0.04 to −0.07 mag. We obtained PSF magnitudes for the entire list of sources identifed in the image by applying the respective PSF. From the resulting subtracted image, we identified new sources, which were added to the previous list to obtain simultaneously new magnitudes. We enlarged the list of sources by iterating this procedure three times. With the aim of dealing with stellar sources we only kept those with χ < 2 and |SHARP| < 0.5. Wee straightforwardly averaged the magnitudes measured from the three images collected per passband for the mean magnitudes and their uncertainties. Errors were estimated from extensive artificial star tests as previously performed for other subsets of Magellanic Cloud clusters that were imaged during the same observing program (Piatti & Koch 2018; Piatti 2018, 2020; Piatti & Bailin 2019; Piatti et al. 2019).
We followed the procedure applied by Piatti & Cole (2017) to clean the cluster CMDs V versus b − y and V versus m13 from field-star contamination (Piatti & Bica 2012). The method relies on using each pair of magnitude and color in a reference field star CMD to subtract the closest star in the cluster CMD. In doing this, we considered the uncertainties in magnitudes and colors by repeating the procedure hundreds of times, and we varied the magnitudes and colors within their respective errors. We used four different regions as reference fields with areas equal to the cluster region, which was delimited by a radius of 20 arcsec from the cluster center. We finally subtracted a number of stars from the cluster CMD equal to that in each reference field star CMD. From the four resulting cleaned cluster CMDs we assigned membership probabilities to each stars based on the number of times they were subtracted in the four cleaning procedures (one per reference field CMD). For instance, stars that appear in all the cleaned CMDs have a membership probability P = 100%, while those in three cleaned CMDs have P = 75%. We tried to complement our membership probability assignments with kinematical information from the Gaia DR2 database (Gaia Collaboration 2016, 2018). Unfortunately, the relatively small and crowded cluster field and its relatively low brightness prevented any accurate measurement of proper motion and parallax of cluster stars. We were barely able to locate ten stars within the cluster radius with very distinct proper motion values.
The Washington CMT1 photometry published by Piatti & Cole (2017) was cross-matched with the present Strömgren photometry, and a master table that included the membership probabilities assigned independently from these data sets was built. In the subsequent analysis, we did not use the T1 magnitudes, which could be affected by contributions from Hα emission lines, so that the hypothesis that slow and fast rotators are the sources of the eMSTO was avoided in our analysis. Nevertheless, the combination of the Washington CM and Strömgren vby magnitudes allowed us to try out different pseudo-colors [≡(m1 − m2)–(m2 − m3), with m1, m2, and m3 being three different magnitudes] to uncover possible trails of the observed eMSTO in NGC 1971. We refer to Monelli et al. (2013) and Milone et al. (2017) for the definition and usefulness of pseudo-colors in the context of multiple population analyses.
3. Analysis and discussion
Piatti & Cole (2017) showed that theoretical isochrones for the cluster age and overall metallicities between [Fe/H] = −0.6 and +0.1 dex (the cluster metallicity is [Fe/H] = −0.3 dex (Dieball & Grebel 2000)) do not cause the observed eMSTO. However, light-element abundance variations were not sought. The Washington C and Strömgren v magnitudes could reflect CN/CH variations (Cummings et al. 2017; Lim et al. 2017). The C and v passbands have effective wavelengths (and full width at half maxima) at λ3910 Å (1100 Å) and λ416 Å (190 Å), respectively, so that both include the CN absorption band at λ4142 Å; the C passband also includes the violet CN bands at λ3595 Å and λ3883 Å. We note that the M bandpass (λ5058 Å (1050 Å)) is free of CN absorption bands. Figure 1 shows the C versus (C − v)–(v − M) diagram in which we highlight with filled blue and red circles the stars that belong to the eMSTO, distributed from the top of the cluster MS down to one magnitude underneath, and with (C − v)–(v − M) values higher and lower than −0.20 mag, respectively. These stars have membership probabilities ≥75% in the Washington and Strömgren data sets.
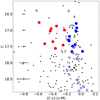 |
Fig. 1. CMD for all the stars measured in the field of NGC 1971 (black dots). Filled blue and red circles represent stars with membership probabilities P ≥ 75% in the Washington and Ströngren data sets, respectively, that are located in a way that they almost cover the cluster eMSTO (16.7 < C (mag) < 17.7). Open symbols represent all the stars with P ≥ 50%. |
The Strömgrem m1 index is known to be sensitive to iron abundance (Calamida et al. 2007), which also measures variations in light elements. Therefore it might reflect both heavy- and light-element abundances or only those from light elements. Because metallicity variations were not found by Piatti & Cole (2017), we conclude that any distinction in the m1 values between blue and red stars might be caused by different CN/CH abundances, which in turn would imply the existence of two different populations among the stars in NGC 1971. Figure 2 depicts the m1 versus v − y diagram for all the measured stars in Fig. 1. It reveals that the two groups of stars selected from Fig. 1 do not exhibit any visible separation. Several stars are clearly separated from the region where most of the blue and red stars are concentrated. These stars could have anomalous chemical compositions, somehow defective Strömgren photometric data, or be interlopers. Figure 2 therefore suggests that NGC 1971 harbors stars with similar light-element abundances. Blue and red stars also overlap in any color-color diagram that involves b − y, v − y, or m1, which means that the Strömgren indices reveal a single-population young cluster with a homogeneous chemical abundance distribution. The above results are expected for young star clusters because MSTO stars have higher temperatures than those of old globular cluster stars. In old globular clusters the magnitude differences between CN-rich and CN-poor stars with similar luminosities are mostly due to the different strengths of molecules including light elements such as C, N, or O (e.g., Marino et al. 2008; Yong et al. 2008; Sbordone et al. 2010). In hotter stars, these differences are small and are unlikely to be consistent with the large color difference between red and blue stars.
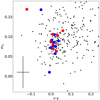 |
Fig. 2. Two-color diagram for stars measured in the field of NGC 1971. Symbols are the same as in Fig. 1. Typical error bars for stars represented by filled blue and red circles are also shown. |
Figure 3 depicts the (C − v)–(v − M) versus C − M diagram, in which the two groups of stars selected from Fig. 1 are clearly differentiated. On the assumption that the Washington-Strömgren metallicity-sensitive passbands (C, v) do not measure any difference between blue and red stars, we conclude that the distinction between the two groups is caused by the Washington M magnitudes. These magnitudes enter with a different sign in the ordinate and abscissa of Figure 3. Moreover, we would conclude the same by comparing, for instance, v − M versus M − y with v − C versus C − y, among other possible combinations. We confirmed this behavior by plotting the pseudo-color diagram (C − b)–(b − y) versus (v − b)–(b − M). In Fig. 4, (C − b)–(b − y) does not reflect any division between blue and red stars, as expected, while (v − b)–(b − M) uncovers the different values due to the M magnitude.
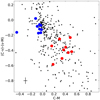 |
Fig. 3. Two-color diagram for stars measured in the field of NGC 1971. Symbols are the saem as in Fig. 1. Typical error bars for stars represented by filled blue and red circles are also shown. |
We searched the literature for spectral features of early MK-type stars in the wavelength range spanned by the Washington M passband, and found that the Hβ emission line is a common feature of Be rotators (see, e.g., Miroshnichenko et al. 2000). According to Fang et al. (2018), Hβ, Hα, and Ca II K emission lines are seen in stars spanning a range of masses and rotations in open clusters as a consequence of their chromospheric activity. The authors also found that Hβ and Hα emissions are correlated.
At this point, our interpretation is that fainter and brighter M magnitudes, which cause the division between blue and red stars in Figs. 1, 3, and 4, correspond to stars with fainter and stronger Hβ emission lines, which in turn are slow and fast rotators (Dmitriev et al. 2019). Furthermore, the difference derived between M and T1 magnitudes of blue and red stars (−0.26 ± 0.07 mag) confirms the correlation found by Fang et al. (2018) between the Hβ and Hα emissions in open clusters. The contribution of Hβ to the M magnitudes explains the eMSTO observed by Piatti & Cole (2017) in the M versus C − M CMD (their Fig. 4), similarly to the way in which Hα contributes to the T1 magnitude in the T1 versus C − T1 CMD. This outcome shows that the eMSTO in the CMD of NGC 1971 is observed whenever passbands with Be emission line contributions are used. This is the first time to our knowledge that Hβ emissions satisfactorily explain the existence of eMSTOs in young clusters. Nevertheless, further spectroscopic confirmation is doubtlessly highly desired. Our result opens new possibilities of studying eMSTOs from observational and theoretical perspectives, by using a larger number of photometric systems with passbands centered on Be features, and by improving theoretical isochrones with rotation effects that widen the range of rotation velocities considered.
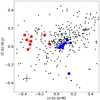 |
Fig. 4. Two-color diagram for stars measured in the field of NGC 1971. Symbols are the same as in Figure 1. Typical error bars for stars represented by filled blue and red circles are also shown. |
4. Conclusions
The origin of eMSTOs in young star clusters is still under debate. In the past years, the general idea has been discussed that neither a real age spread nor stellar evolutionary effects alone explain the observed broadness of the upper part of cluster main-sequence stars (Goudfrooij et al. 2017, 2018; Gossage et al. 2019; Li et al. 2020). Moreover, some star clusters do not seem to exhibit any eMSTO (de Juan Ovelar et al. 2020). In this context, the noticeable large age spread found for NGC 1971 by Piatti & Cole (2017), which is similar to the cluster age (∼160 Myr), caught our attention.
We made use of publicly available and not yet exploited Strömgren vby images centered on the cluster, obtained with the SOAR SOI, to search for additional clues about the noticeable eMSTO of NGC 1971. The accurate Strömgren photometry obtained, alongside the published Washington photometry, allowed us to explore the nature of the broadness in the upper part of the cluster MS observed by Piatti & Cole (2017). During the analysis, we constrained the sample of stars to those with assigned membership probabilities P ≥ 75% in both photometric data sets, separately. The selected sample consists of 18 stars distributed from the top of the cluster MS down to one magnitude underneath, and spans the range of eMSTO colors.
From an appropriate combination of Washington and Strömgren magnitudes, we built different pseudo-colors and found that (i) the selected stars can be split into two groups of stars (blue and red), with nine stars each; and (ii) the cluster does not seem to show inhomogeneities of light- and heavy-element abundances. On the contrary, both groups of selected stars resemble a single stellar population with a homogeneous chemical abundance level. (iii) Blue and red stars are clearly separated only when the Washington M magnitudes are involved, which means that the M magnitudes cause the appearance of the eMSTO. The spectral region covered by the M passband comprises Hβ, which in emission is a common feature of Be stars. Therefore we speculate that Be stars populate the redder group of stars, which agrees very well with previous findings of eMSTOs in young clusters (e.g., Bastian et al. 2017). In particular, our result reinforces the suggestion that Hα emissions of Be stars may have contributed to the T1 magnitudes in Piatti & Cole (2017), and hence to the detection of an eMSTO. We confirmed this possibility with the tight correlation between M and T1 magnitudes, which has also been shown to hold between Hβ and Hα emissions of Be stars in open clusters.
Acknowledgments
I thank the referee for the thorough reading of the manuscript and the suggestions to improve it.
References
- Bastian, N., Cabrera-Ziri, I., Niederhofer, F., et al. 2017, MNRAS, 465, 4795 [NASA ADS] [CrossRef] [Google Scholar]
- Calamida, A., Bono, G., Stetson, P. B., et al. 2007, ApJ, 670, 400 [NASA ADS] [CrossRef] [Google Scholar]
- Canterna, R. 1976, AJ, 81, 228 [NASA ADS] [CrossRef] [Google Scholar]
- Cordoni, G., Milone, A. P., Marino, A. F., et al. 2018, ApJ, 869, 139 [NASA ADS] [CrossRef] [Google Scholar]
- Crawford, D. L., & Mandwewala, N. 1976, PASP, 88, 917 [NASA ADS] [CrossRef] [Google Scholar]
- Cummings, J. D., Geisler, D., & Villanova, S. 2017, AJ, 153, 192 [NASA ADS] [CrossRef] [Google Scholar]
- D’Antona, F., Milone, A. P., Tailo, M., et al. 2017, Nat. Astron., 1, 0186 [NASA ADS] [CrossRef] [Google Scholar]
- de Juan Ovelar, M., Gossage, S., Kamann, S., et al. 2020, MNRAS, 491, 2129 [Google Scholar]
- Dieball, A., & Grebel, E. K. 2000, A&A, 358, 897 [NASA ADS] [Google Scholar]
- Dmitriev, D. V., Grinin, V. P., & Katysheva, N. A. 2019, Astron. Lett., 45, 371 [CrossRef] [Google Scholar]
- Dupree, A. K., Dotter, A., Johnson, C. I., et al. 2017, ApJ, 846, L1 [NASA ADS] [CrossRef] [Google Scholar]
- Fang, X.-S., Zhao, G., Zhao, J.-K., & Bharat Kumar, Y. 2018, MNRAS, 476, 908 [NASA ADS] [CrossRef] [Google Scholar]
- Gaia Collaboration (Prusti, T., et al.) 2016, A&A, 595, A1 [NASA ADS] [CrossRef] [EDP Sciences] [Google Scholar]
- Gaia Collaboration (Brown, A. G. A., et al.) 2018, A&A, 616, A1 [NASA ADS] [CrossRef] [EDP Sciences] [Google Scholar]
- Gossage, S., Conroy, C., Dotter, A., et al. 2019, ApJ, 887, 199 [CrossRef] [Google Scholar]
- Goudfrooij, P., Girardi, L., & Correnti, M. 2017, ApJ, 846, 22 [NASA ADS] [CrossRef] [Google Scholar]
- Goudfrooij, P., Girardi, L., Bellini, A., et al. 2018, ApJ, 864, L3 [NASA ADS] [CrossRef] [Google Scholar]
- Hauck, B., & Mermilliod, M. 1998, A&AS, 129, 431 [NASA ADS] [CrossRef] [EDP Sciences] [Google Scholar]
- Li, Z., Chen, J., Zhang, S., Deng, Y., & Zhao, W. 2020, Ap&SS, 365, 134 [CrossRef] [Google Scholar]
- Lim, D., Hong, S., & Lee, Y.-W. 2017, ApJ, 844, 14 [NASA ADS] [CrossRef] [Google Scholar]
- Marino, A. F., Villanova, S., Piotto, G., et al. 2008, A&A, 490, 625 [NASA ADS] [CrossRef] [EDP Sciences] [Google Scholar]
- Marino, A. F., Milone, A. P., Casagrande, L., et al. 2018a, ApJ, 863, L33 [NASA ADS] [CrossRef] [Google Scholar]
- Marino, A. F., Przybilla, N., Milone, A. P., et al. 2018b, AJ, 156, 116 [NASA ADS] [CrossRef] [Google Scholar]
- Marino, A. F., Milone, A. P., Renzini, A., et al. 2019, MNRAS, 487, 3815 [NASA ADS] [CrossRef] [Google Scholar]
- Milone, A. P., Piotto, G., Renzini, A., et al. 2017, MNRAS, 464, 3636 [NASA ADS] [CrossRef] [Google Scholar]
- Milone, A. P., Marino, A. F., Di Criscienzo, M., et al. 2018, MNRAS, 477, 2640 [NASA ADS] [CrossRef] [Google Scholar]
- Miroshnichenko, A. S., Chentsov, E. L., Klochkova, V. G., et al. 2000, A&AS, 147, 5 [NASA ADS] [CrossRef] [EDP Sciences] [Google Scholar]
- Monelli, M., Milone, A. P., Stetson, P. B., et al. 2013, MNRAS, 431, 2126 [NASA ADS] [CrossRef] [Google Scholar]
- Paunzen, E. 2015, A&A, 580, A23 [NASA ADS] [CrossRef] [EDP Sciences] [Google Scholar]
- Piatti, A. E. 2018, AJ, 156, 206 [CrossRef] [Google Scholar]
- Piatti, A. E. 2020, A&A, 642, A114 [CrossRef] [EDP Sciences] [Google Scholar]
- Piatti, A. E., & Bailin, J. 2019, AJ, 157, 49 [CrossRef] [Google Scholar]
- Piatti, A. E., & Bica, E. 2012, MNRAS, 425, 3085 [NASA ADS] [CrossRef] [Google Scholar]
- Piatti, A. E., & Cole, A. 2017, MNRAS, 470, L77 [NASA ADS] [CrossRef] [Google Scholar]
- Piatti, A. E., & Koch, A. 2018, ApJ, 867, 8 [NASA ADS] [CrossRef] [Google Scholar]
- Piatti, A. E., Pietrzyński, G., Narloch, W., Górski, M., & Graczyk, D. 2019, MNRAS, 483, 4766 [NASA ADS] [CrossRef] [Google Scholar]
- Sbordone, L., Bonifacio, P., Caffau, E., et al. 2010, A&A, 522, A26 [NASA ADS] [CrossRef] [EDP Sciences] [Google Scholar]
- Stetson, P. B., Davis, L. E., & Crabtree, D. R. 1990, in CCDs in Astronomy, ed. G. H. Jacoby, ASP Conf. Ser., 8, 289 [Google Scholar]
- Yong, D., Meléndez, J., Cunha, K., et al. 2008, ApJ, 689, 1020 [NASA ADS] [CrossRef] [Google Scholar]
All Figures
|
Fig. 1. CMD for all the stars measured in the field of NGC 1971 (black dots). Filled blue and red circles represent stars with membership probabilities P ≥ 75% in the Washington and Ströngren data sets, respectively, that are located in a way that they almost cover the cluster eMSTO (16.7 < C (mag) < 17.7). Open symbols represent all the stars with P ≥ 50%. |
| In the text | |
|
Fig. 2. Two-color diagram for stars measured in the field of NGC 1971. Symbols are the same as in Fig. 1. Typical error bars for stars represented by filled blue and red circles are also shown. |
| In the text | |
|
Fig. 3. Two-color diagram for stars measured in the field of NGC 1971. Symbols are the saem as in Fig. 1. Typical error bars for stars represented by filled blue and red circles are also shown. |
| In the text | |
|
Fig. 4. Two-color diagram for stars measured in the field of NGC 1971. Symbols are the same as in Figure 1. Typical error bars for stars represented by filled blue and red circles are also shown. |
| In the text | |
Current usage metrics show cumulative count of Article Views (full-text article views including HTML views, PDF and ePub downloads, according to the available data) and Abstracts Views on Vision4Press platform.
Data correspond to usage on the plateform after 2015. The current usage metrics is available 48-96 hours after online publication and is updated daily on week days.
Initial download of the metrics may take a while.