Free Access
Fig. 3.
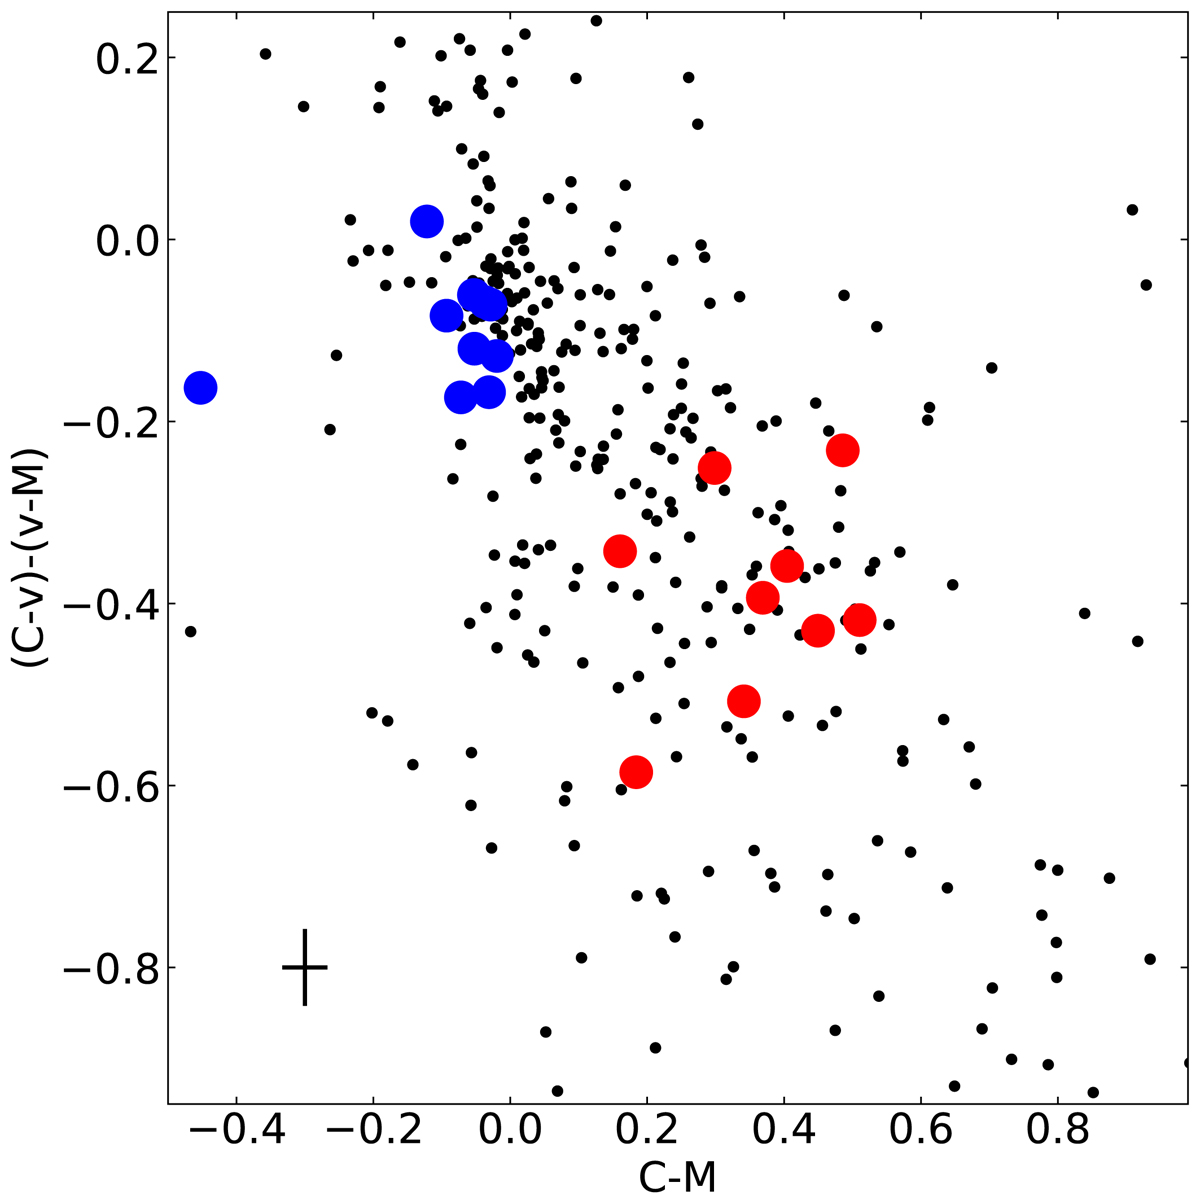
Two-color diagram for stars measured in the field of NGC 1971. Symbols are the saem as in Fig. 1. Typical error bars for stars represented by filled blue and red circles are also shown.
Current usage metrics show cumulative count of Article Views (full-text article views including HTML views, PDF and ePub downloads, according to the available data) and Abstracts Views on Vision4Press platform.
Data correspond to usage on the plateform after 2015. The current usage metrics is available 48-96 hours after online publication and is updated daily on week days.
Initial download of the metrics may take a while.