Free Access
Fig. 9.
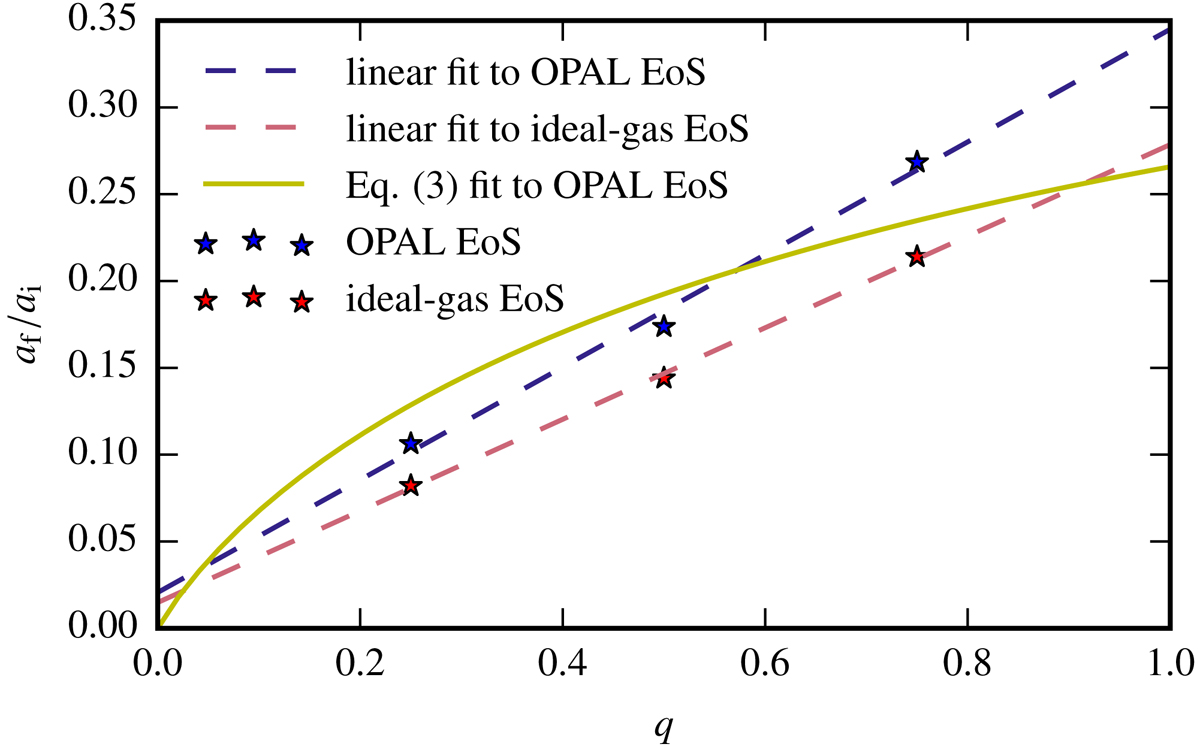
Final orbital configuration as a function of q. Linear fits (dashed lines) to the three data points per EoS (stars) are shown in blue (OPAL EoS) and red (ideal-gas EoS). A fit to Eq. (3) with αλ = 2.1 is shown in yellow.
Current usage metrics show cumulative count of Article Views (full-text article views including HTML views, PDF and ePub downloads, according to the available data) and Abstracts Views on Vision4Press platform.
Data correspond to usage on the plateform after 2015. The current usage metrics is available 48-96 hours after online publication and is updated daily on week days.
Initial download of the metrics may take a while.