Fig. 8.
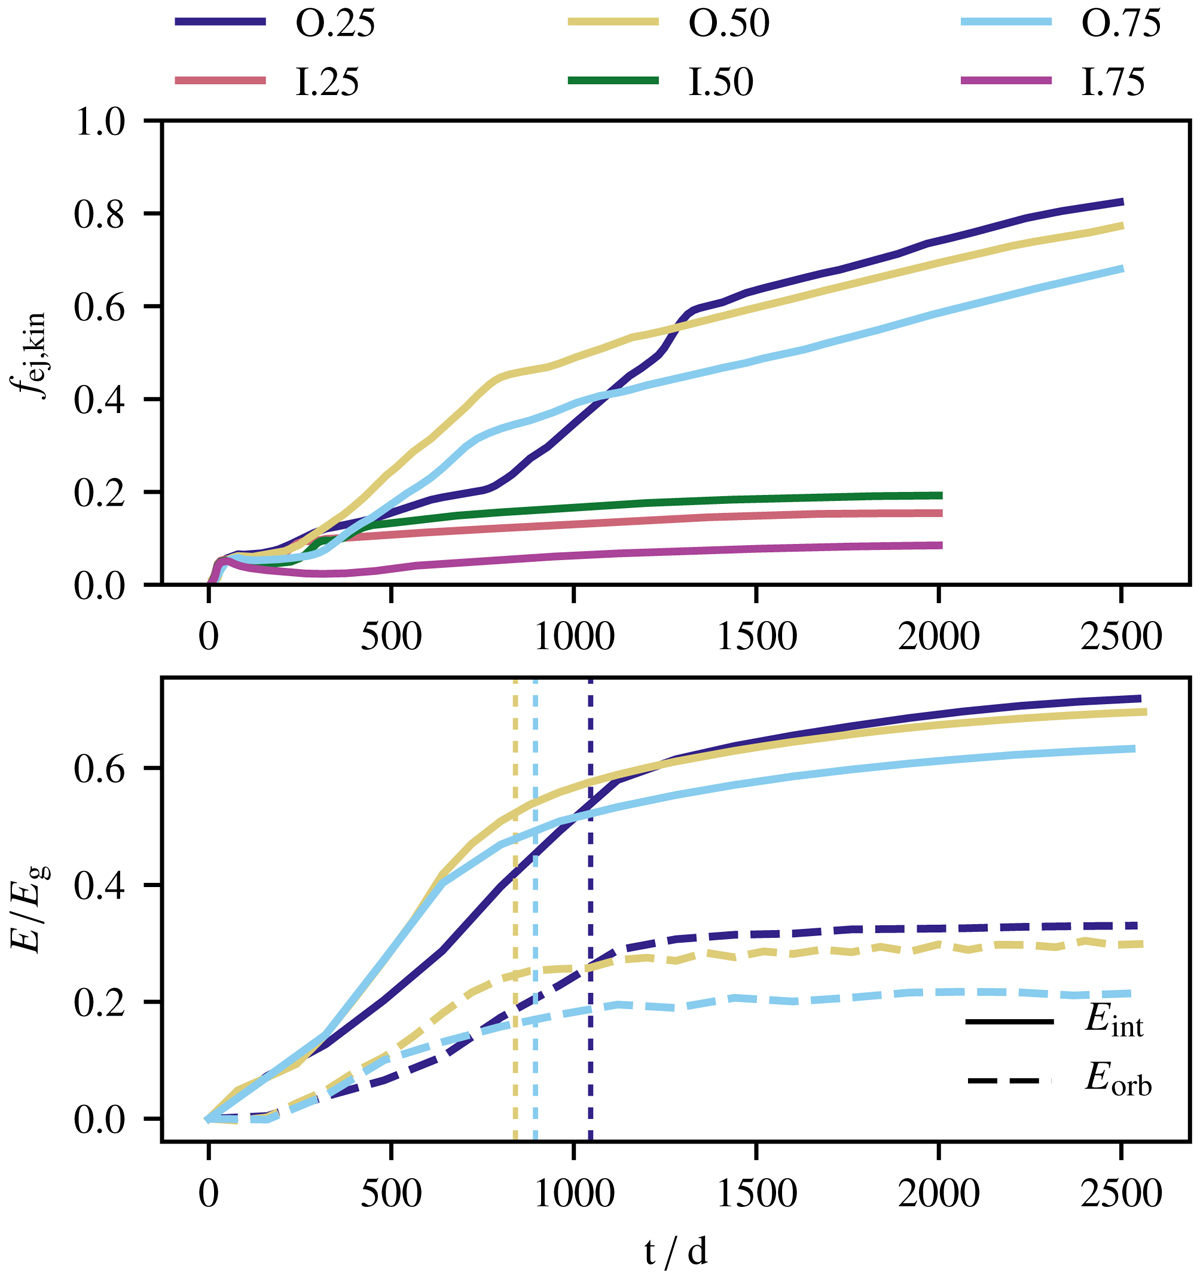
Ejected mass and energy budget for different companions. In the upper panel, the unbound mass fraction over time accounting for kinetic energy only is shown. Dark blue, yellow and light blue lines (OPAL EoS), red, green and purple lines (ideal-gas EoS) are for q = 0.25, q = 0.5 and q = 0.75, respectively. In the lower panel, the released internal (continuous) and orbital energies (dashed lines) are plotted as fractions of the gravitational binding energy for the OPAL runs. The vertical dotted lines indicate tpi from Table 3.
Current usage metrics show cumulative count of Article Views (full-text article views including HTML views, PDF and ePub downloads, according to the available data) and Abstracts Views on Vision4Press platform.
Data correspond to usage on the plateform after 2015. The current usage metrics is available 48-96 hours after online publication and is updated daily on week days.
Initial download of the metrics may take a while.