Fig. 7.
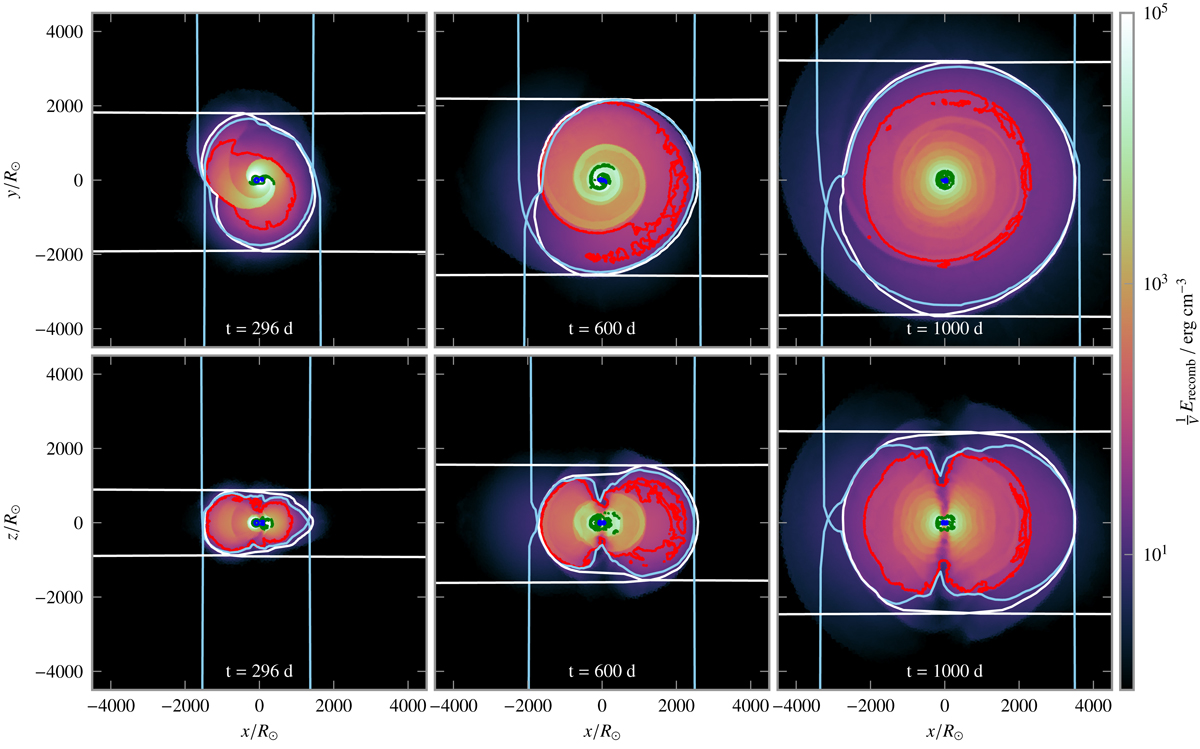
Available ionization energy of Model O.50 in the orbital plane at the beginning of the simulation, after one and after four orbits. The white and light blue lines represent projections of the photosphere along the axes (i.e., they outline the opaque region). The red, green and dark blue contours enclose regions with ionization fractions of H, HeI, and HeII larger than 0.2, respectively.
Current usage metrics show cumulative count of Article Views (full-text article views including HTML views, PDF and ePub downloads, according to the available data) and Abstracts Views on Vision4Press platform.
Data correspond to usage on the plateform after 2015. The current usage metrics is available 48-96 hours after online publication and is updated daily on week days.
Initial download of the metrics may take a while.