Fig. 6.
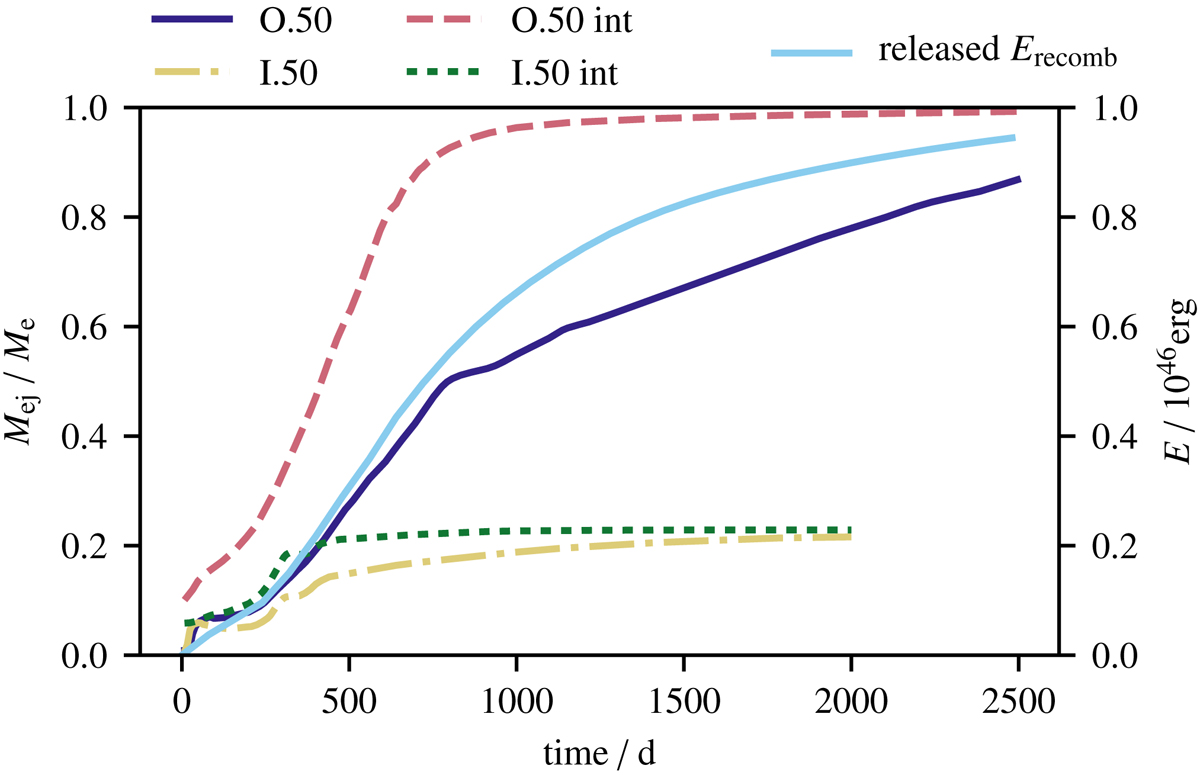
Fraction of ejected mass, Mej, over time for the O.50 (dark blue and red) and the I.50 (yellow and green line) models. It is plotted with kinetic energy only (dark blue and yellow line) and including internal energy (red and green line), respectively, for I.50 (where internal means thermal energy) and O.50 (where internal means thermal plus recombination energy), respectively. The released recombination energy is shown in light blue on the right-hand axis.
Current usage metrics show cumulative count of Article Views (full-text article views including HTML views, PDF and ePub downloads, according to the available data) and Abstracts Views on Vision4Press platform.
Data correspond to usage on the plateform after 2015. The current usage metrics is available 48-96 hours after online publication and is updated daily on week days.
Initial download of the metrics may take a while.