Fig. 1.
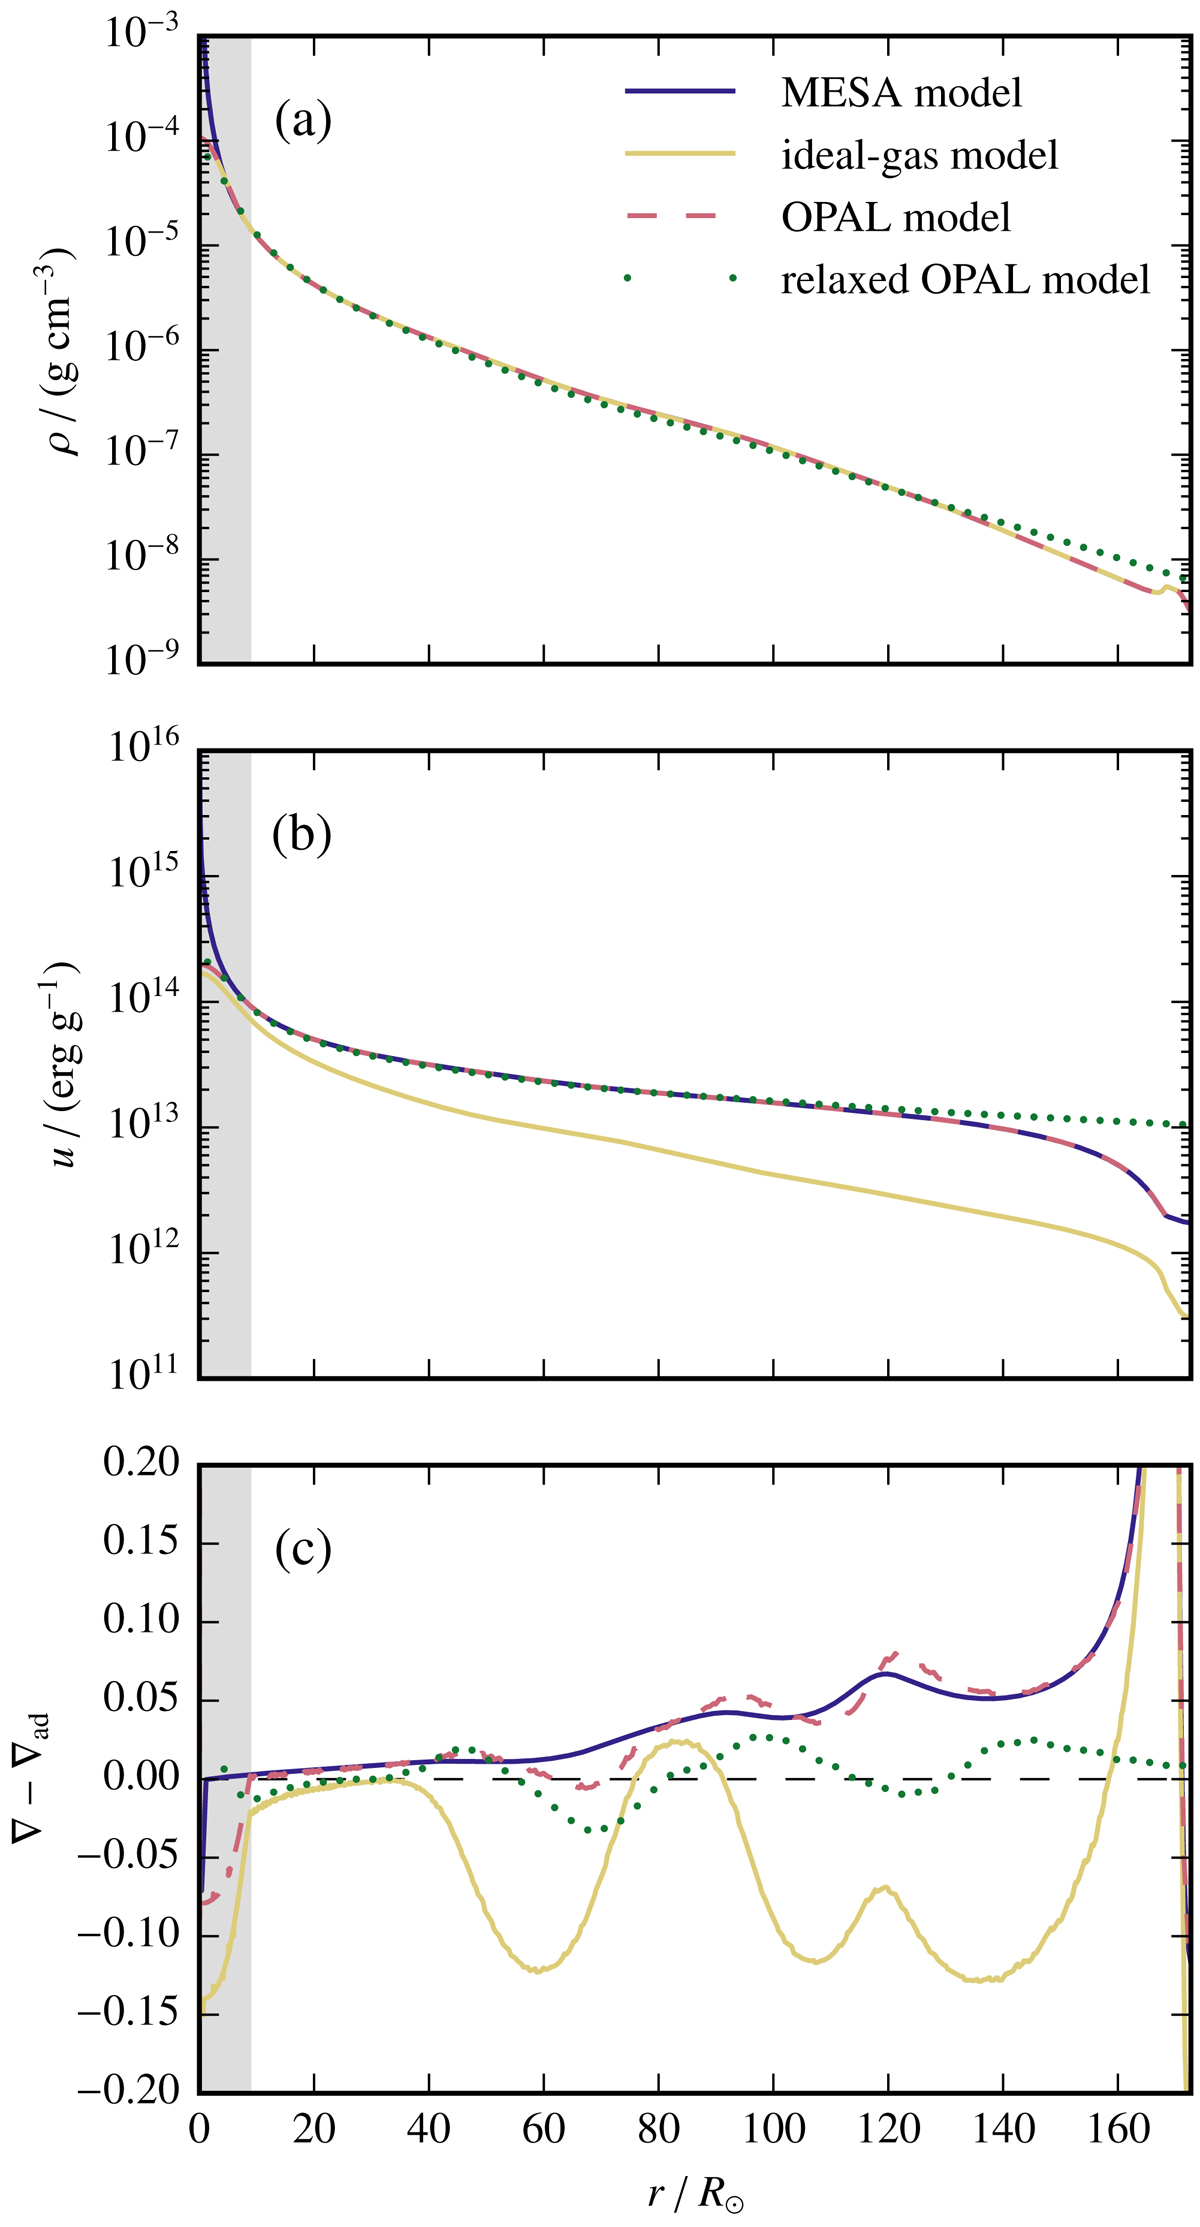
Comparison of the initial profiles of the initial MESA model for the primary star (blue) and the modified models with ideal-gas (yellow) and OPAL (red) equations of state before the relaxation. The gray area indicates the region inside the cut-off radius rcut. The density ρ is shown in panel a (the density profile of the MESA model is hidden behind that of the ideal-gas and OPAL model). The green dots are averaged values of cells in the OPAL model after the relaxation. The specific internal energy u is shown in panel b. The difference between the temperature gradient ∇ and the adiabatic gradient ∇ad is shown in panel c.
Current usage metrics show cumulative count of Article Views (full-text article views including HTML views, PDF and ePub downloads, according to the available data) and Abstracts Views on Vision4Press platform.
Data correspond to usage on the plateform after 2015. The current usage metrics is available 48-96 hours after online publication and is updated daily on week days.
Initial download of the metrics may take a while.