Fig. 9.
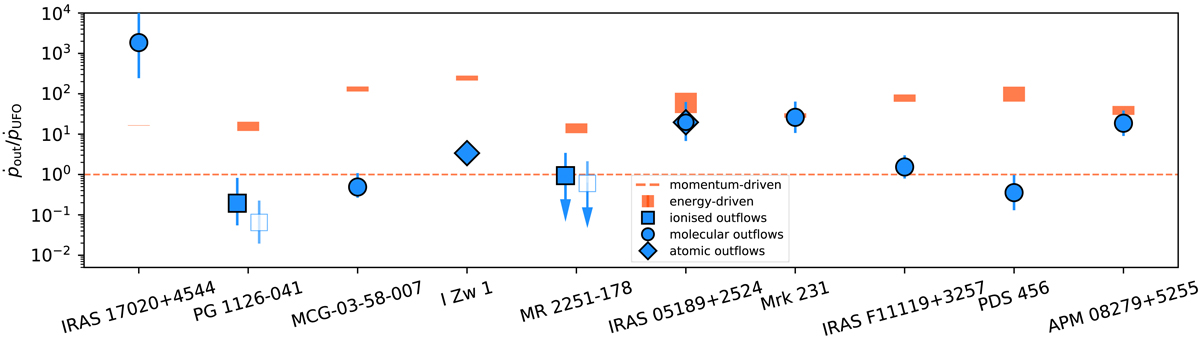
Ratio between galaxy-scale and sub-pc-scale outflow momentum rates for different QSOs hosting UFOs. Measurements for individual galaxies are shown as squares (ionised outflows), circles (molecular outflows), and diamonds (atomic outflows) with error-bars. Systems are ordered by increasing LBOL. The horizontal dashed line shows the prediction for momentum-driven winds (ṗout/ṗUFO = 1), individual predictions for energy-driven winds are shown as orange rectangles. Our Hα and [O III] measurements for MR 2251−178 and PG 1126−041 are shown separately using filled and empty symbols, respectively.
Current usage metrics show cumulative count of Article Views (full-text article views including HTML views, PDF and ePub downloads, according to the available data) and Abstracts Views on Vision4Press platform.
Data correspond to usage on the plateform after 2015. The current usage metrics is available 48-96 hours after online publication and is updated daily on week days.
Initial download of the metrics may take a while.