Fig. 7.
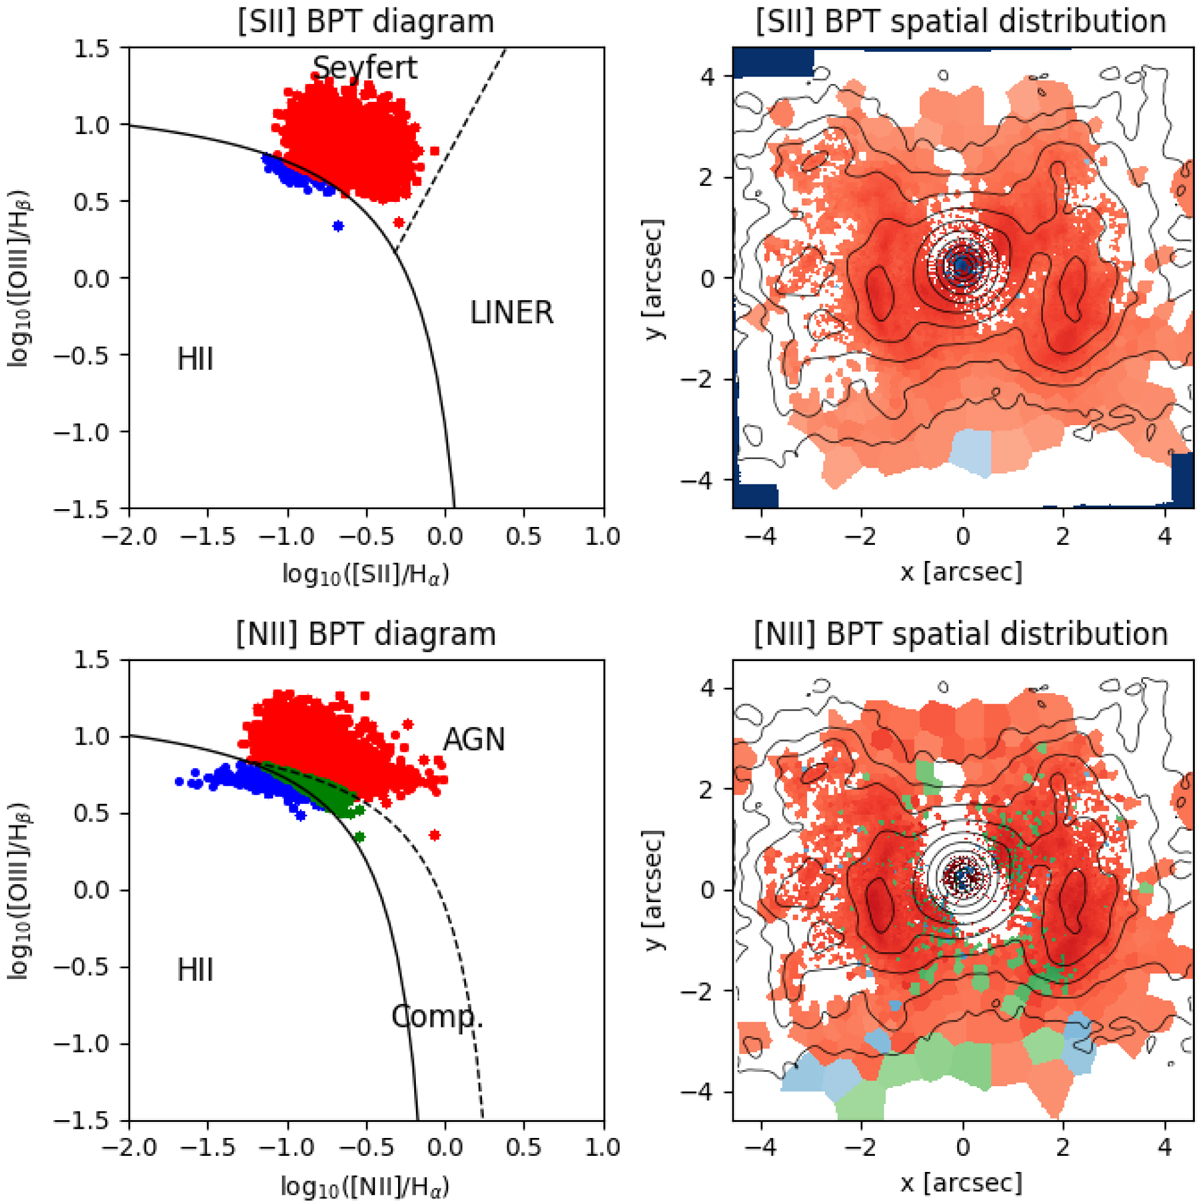
Left panels: spatially resolved [S II]- and [N II]- BPT diagrams for MR 2251−178. Each dot corresponds to a single Voronoi bin. Red (blue) dots represent regions whose excitation is dominated by star formation (AGN), green dots are used for composite (in the [N II]-BPT) or LI(N)ER (in the [S II]-BPT) excitation regimes. Solid and dashed black lines show the separation between the different regimes, from Kewley et al. (2001, 2006) and Kauffmann et al. (2003). Only lines with S/N > 2 are used. Right panels: [S II]- and [N II]- BPT maps, colour-coded according to the dominant excitation regime. Darker colours indicate higher [S II] (top panel) or [N II] (bottom panel) intensities. Iso-intensity contours show the integrated [O III] line, smoothed to a FHWM resolution of 0.25″. The ionisation of the nebula is vastly dominated by the AGN.
Current usage metrics show cumulative count of Article Views (full-text article views including HTML views, PDF and ePub downloads, according to the available data) and Abstracts Views on Vision4Press platform.
Data correspond to usage on the plateform after 2015. The current usage metrics is available 48-96 hours after online publication and is updated daily on week days.
Initial download of the metrics may take a while.