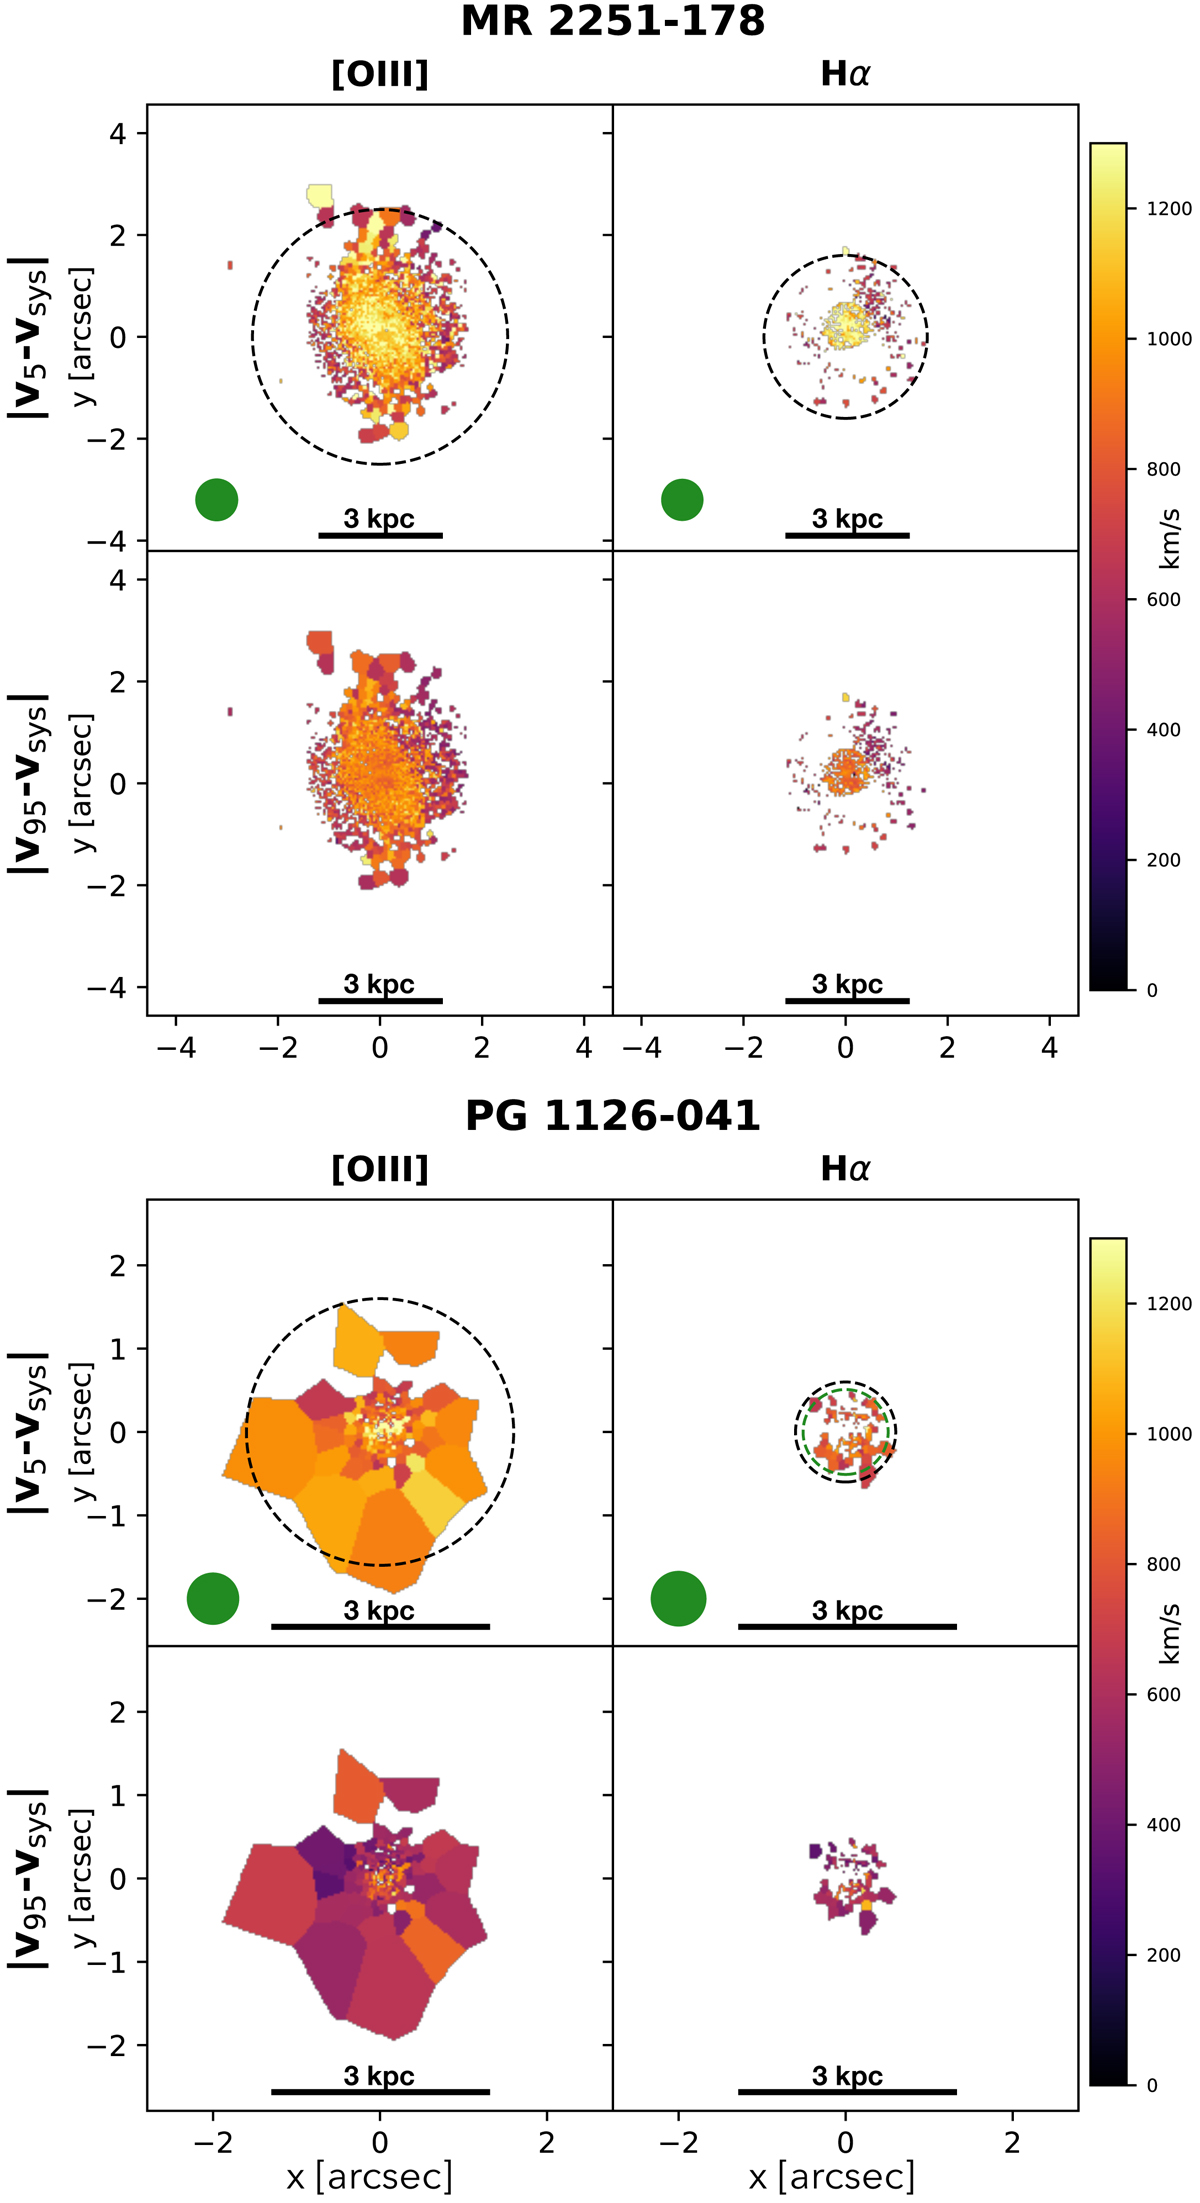
Fig. 6.

Top panels: [O III] and Hα velocity maps showing fifth (first row) and ninety-fifth (second row) velocity percentiles of the HV components in MR 2251−178. The dashed circles show the maximum Rout adopted for the calculation of the momentum boost. The green filled circles indicate the size of the PSF halo, which is markedly smaller than the spatial extent of the data. Bottom panels: same as for PG 1126−041. The green dashed circle in the Hα panel shows the outflow radius corrected for the effect of the PSF.
Current usage metrics show cumulative count of Article Views (full-text article views including HTML views, PDF and ePub downloads, according to the available data) and Abstracts Views on Vision4Press platform.
Data correspond to usage on the plateform after 2015. The current usage metrics is available 48-96 hours after online publication and is updated daily on week days.
Initial download of the metrics may take a while.


