Fig. 5.
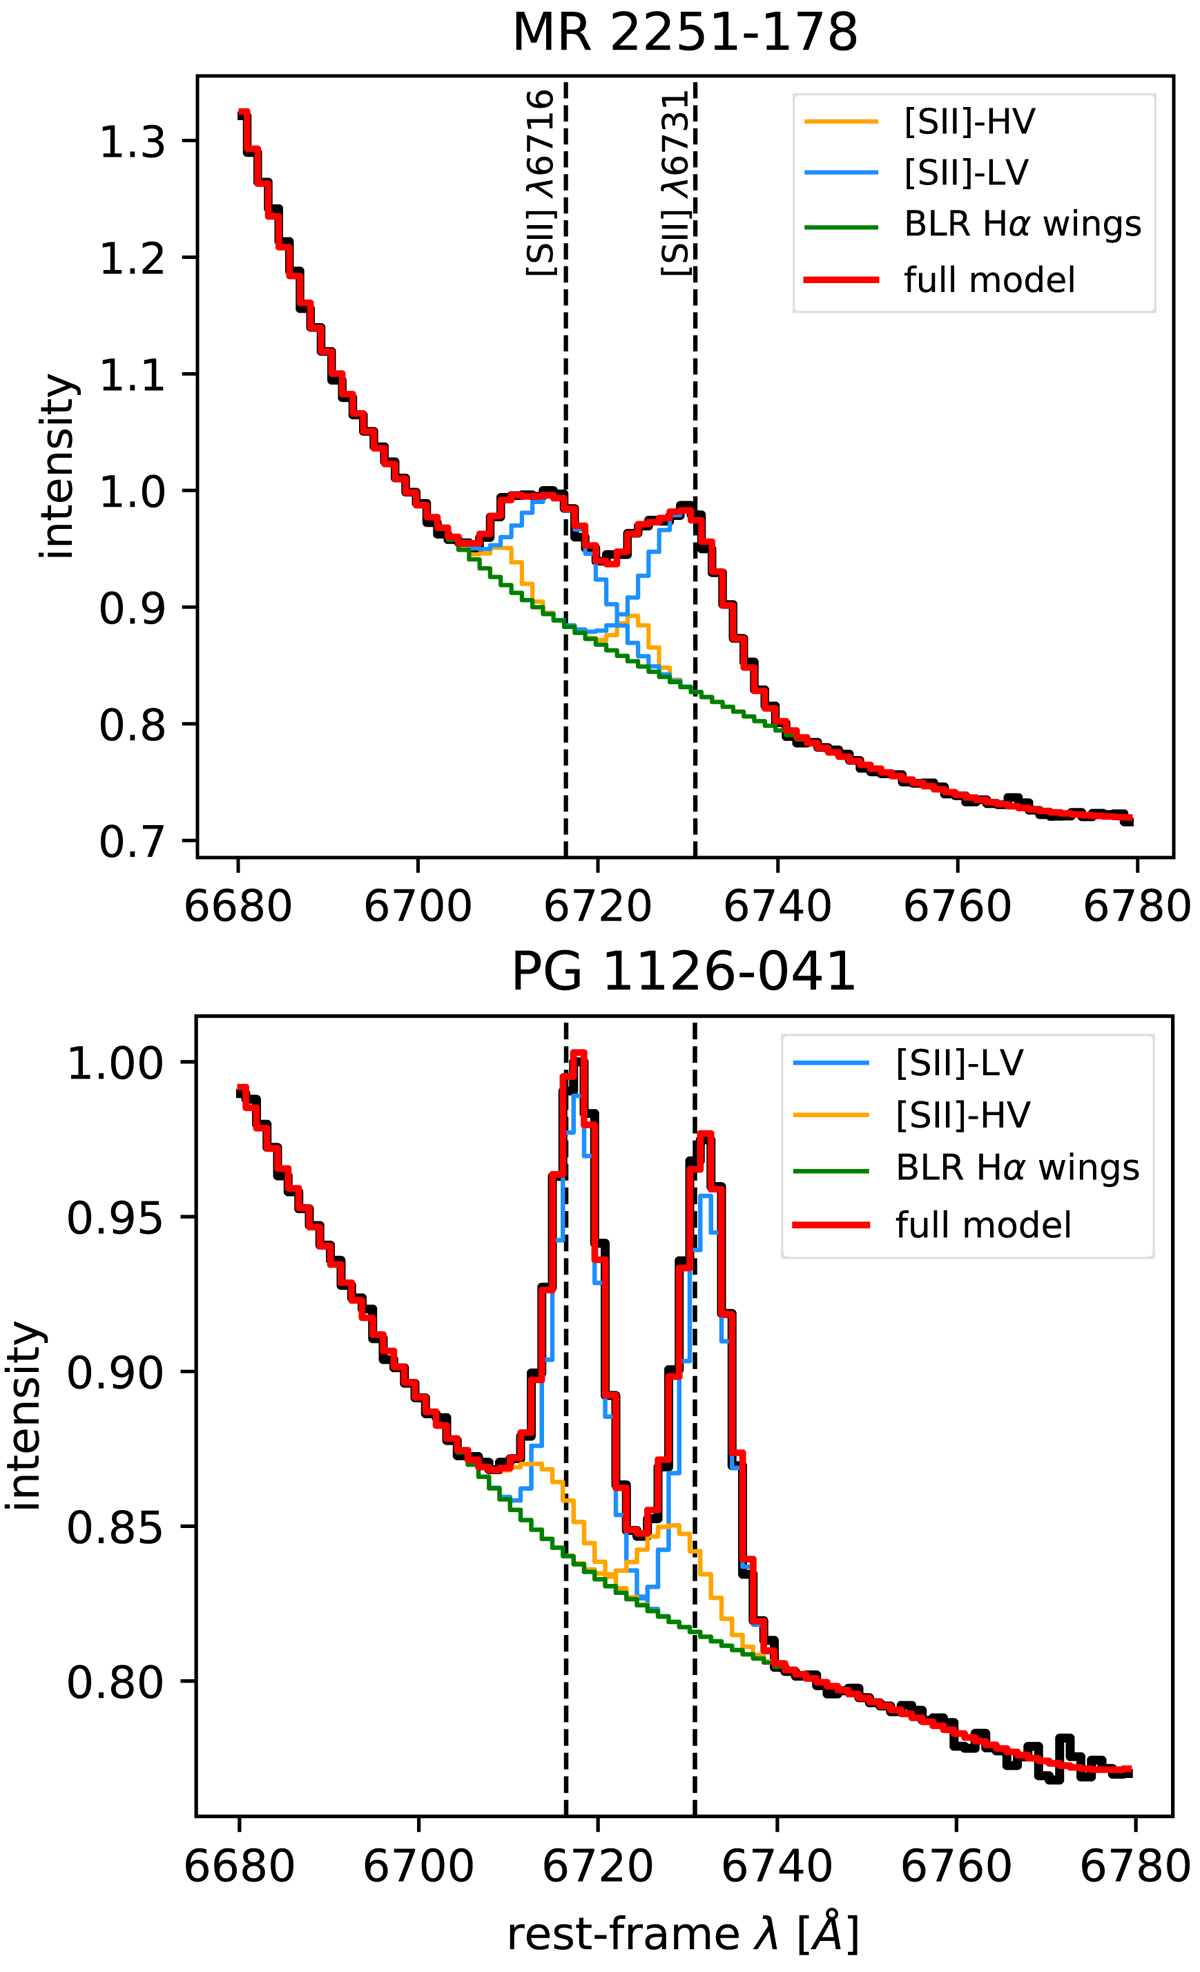
[S II] emission lines and related models for MR 2251−178 (top panel) and PG 1126−041 (bottom panel). The black lines show the spectrum extracted within an aperture of 0.05″ (for MR 2251−178) and 0.5″ (for PG 1126−041) from the systems’ nuclei. The red lines show our best-fit models, with separate contributions from the wings of the BLR Hα (green lines), and the HV- and LV-components of the [S II] doublets (orange and blue lines, respectively).
Current usage metrics show cumulative count of Article Views (full-text article views including HTML views, PDF and ePub downloads, according to the available data) and Abstracts Views on Vision4Press platform.
Data correspond to usage on the plateform after 2015. The current usage metrics is available 48-96 hours after online publication and is updated daily on week days.
Initial download of the metrics may take a while.