Fig. 4.
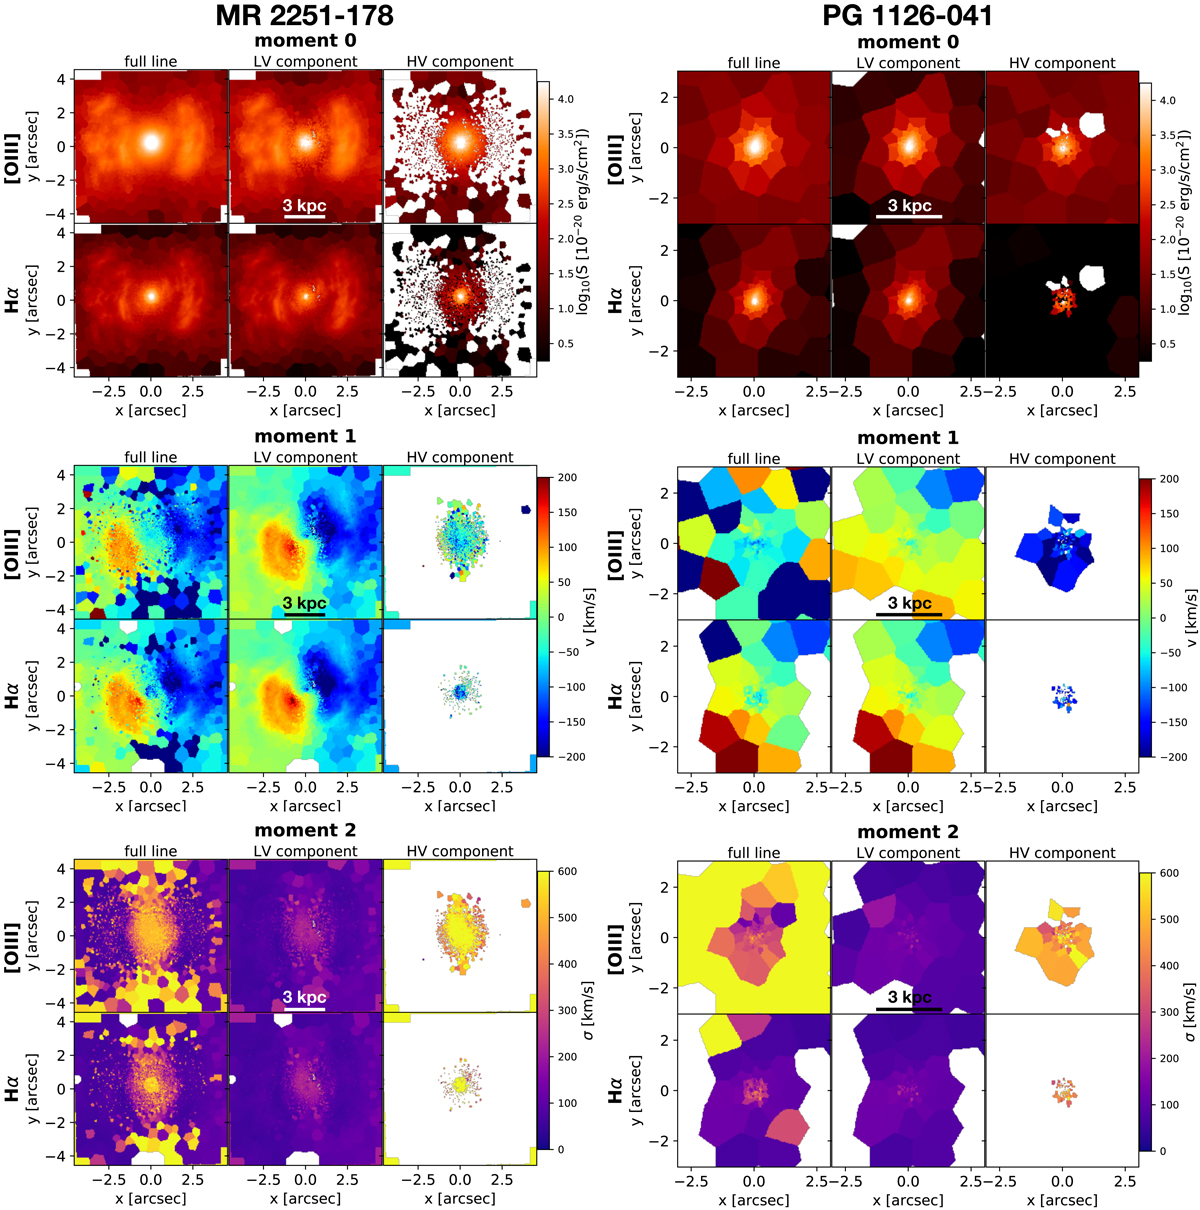
Distribution and kinematics of diffuse ionised gas in MR 2251−178 (left-hand panels) and PG 1126−041 (right-hand panels). For each system, the set of six panels on top (middle, bottom) show the moment-0 (moment-1, moment-2) map for the [O III] (first row) and the Hα (second row) emission lines from diffuse gas. The different columns show the maps derived for the whole line, or for the LV and the HV components separately. Moment-1 and moment-2 maps are clipped at a peak S/N of 3. Moment-1 maps are relative to the systemic velocity of the QSOs, given by their estimated redshift.
Current usage metrics show cumulative count of Article Views (full-text article views including HTML views, PDF and ePub downloads, according to the available data) and Abstracts Views on Vision4Press platform.
Data correspond to usage on the plateform after 2015. The current usage metrics is available 48-96 hours after online publication and is updated daily on week days.
Initial download of the metrics may take a while.