Fig. 3.
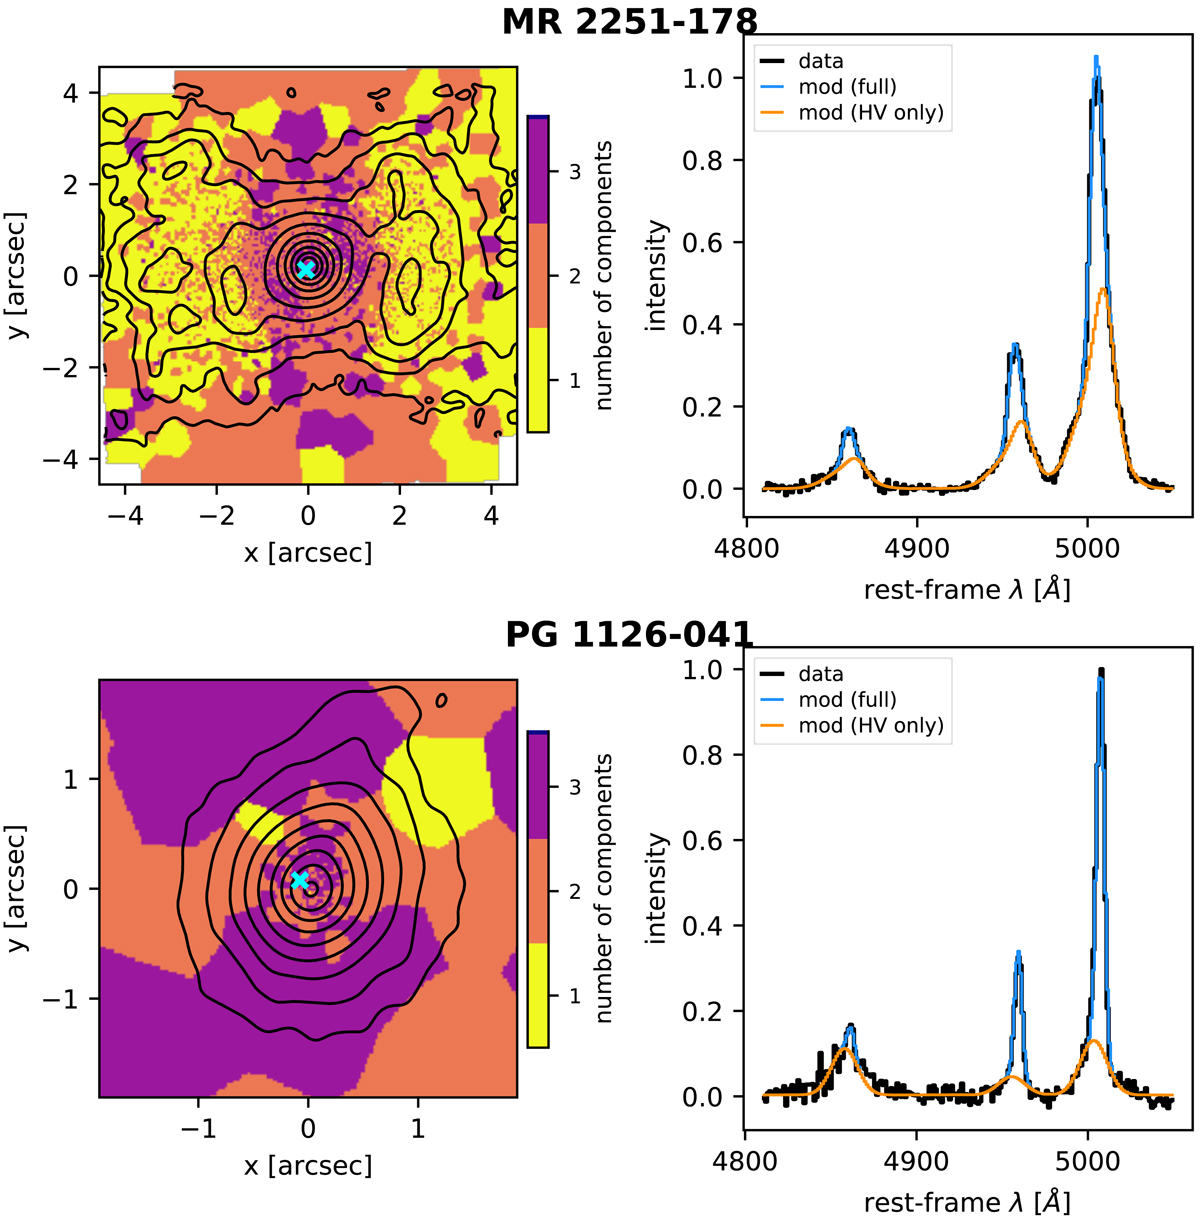
Multi-component fit for diffuse gas emission lines of MR 2251−178 (top panels) and PG 1126−041 (bottom panels). Left-hand panels: iso-intensity contours for the integrated [O III] line (black lines); the background colours show the number of components used in each Voronoi bin. The [O III] maps are derived by integrating the (unbinned) BLR-subtracted cubes in the λλ4930−5030 Å rest-frame range and are spatially smoothed to a FWHM resolution of 0.25″. Contours are spaced by a factor of 2, the outermost being at 3× the rms noise. The crosses in cyan mark the bins at which the spectra shown in the right panels are extracted. Right-hand panels: representative spectra in a range encompassing the Hβ and [O III] lines for the BLR-subtracted cubes (black lines), our best-fit models (blue lines), and their HV sub-components alone (orange lines).
Current usage metrics show cumulative count of Article Views (full-text article views including HTML views, PDF and ePub downloads, according to the available data) and Abstracts Views on Vision4Press platform.
Data correspond to usage on the plateform after 2015. The current usage metrics is available 48-96 hours after online publication and is updated daily on week days.
Initial download of the metrics may take a while.