Fig. 2.
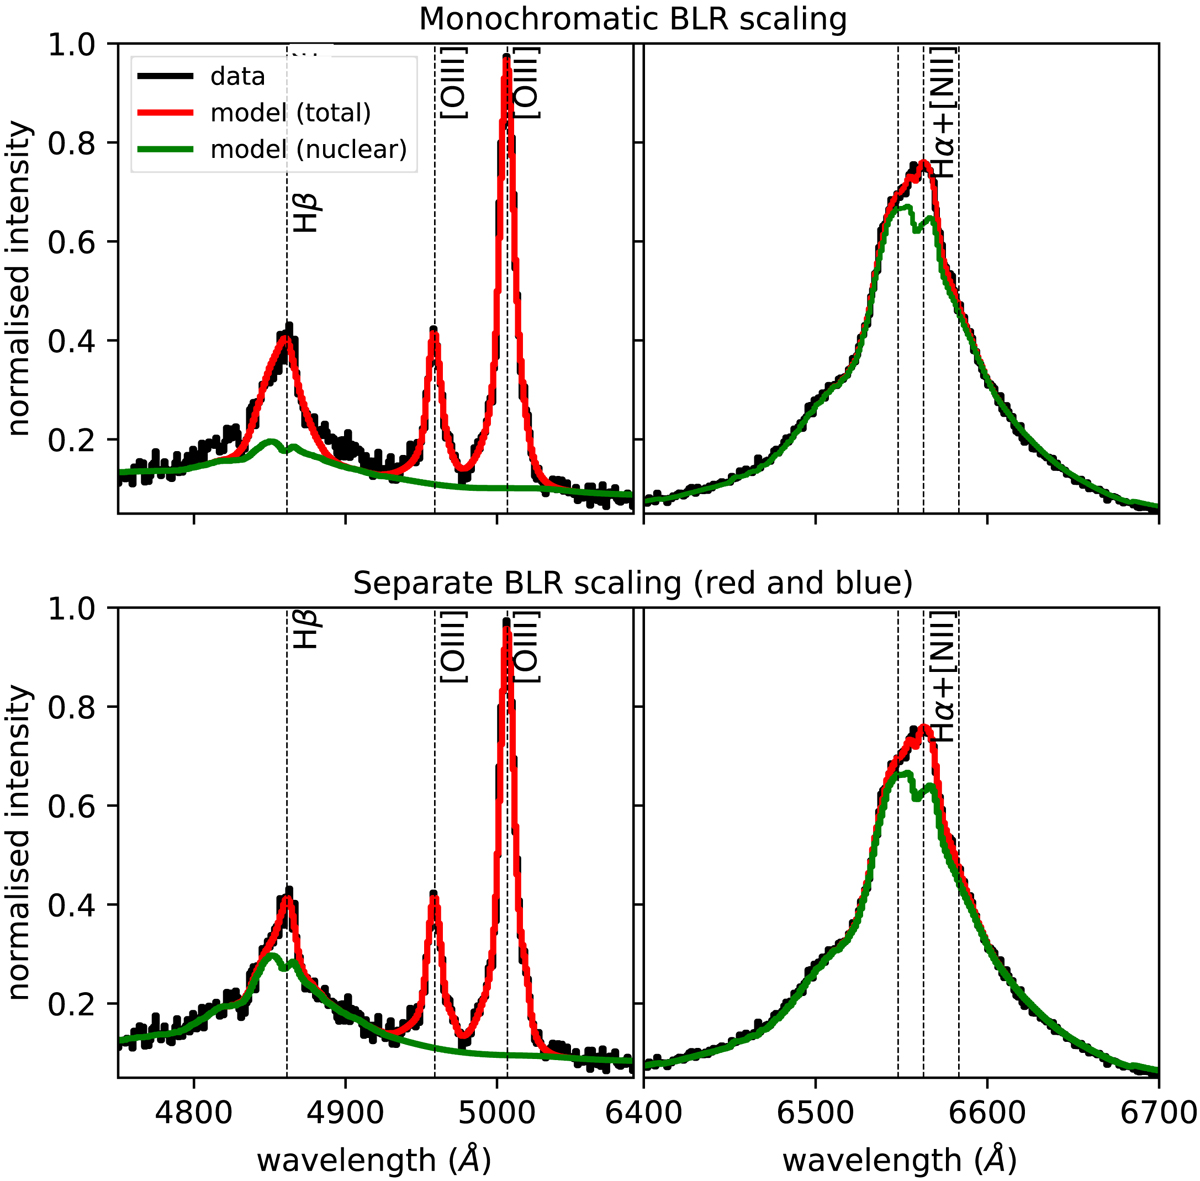
Representative spectrum taken at 0.34″ from centre of MR 2251−178 (black lines in all panels), and best-fit models (red lines) derived by re-normalising the BLR contribution either as a whole (top panels), or for the red and blue regimes separately (bottom panels), as discussed in the text. The green lines show the contribution of the BLR emission to the full spectrum. The separate normalisation leads to a much better fit to the Hβ line (left panels).
Current usage metrics show cumulative count of Article Views (full-text article views including HTML views, PDF and ePub downloads, according to the available data) and Abstracts Views on Vision4Press platform.
Data correspond to usage on the plateform after 2015. The current usage metrics is available 48-96 hours after online publication and is updated daily on week days.
Initial download of the metrics may take a while.