Fig. A.1.
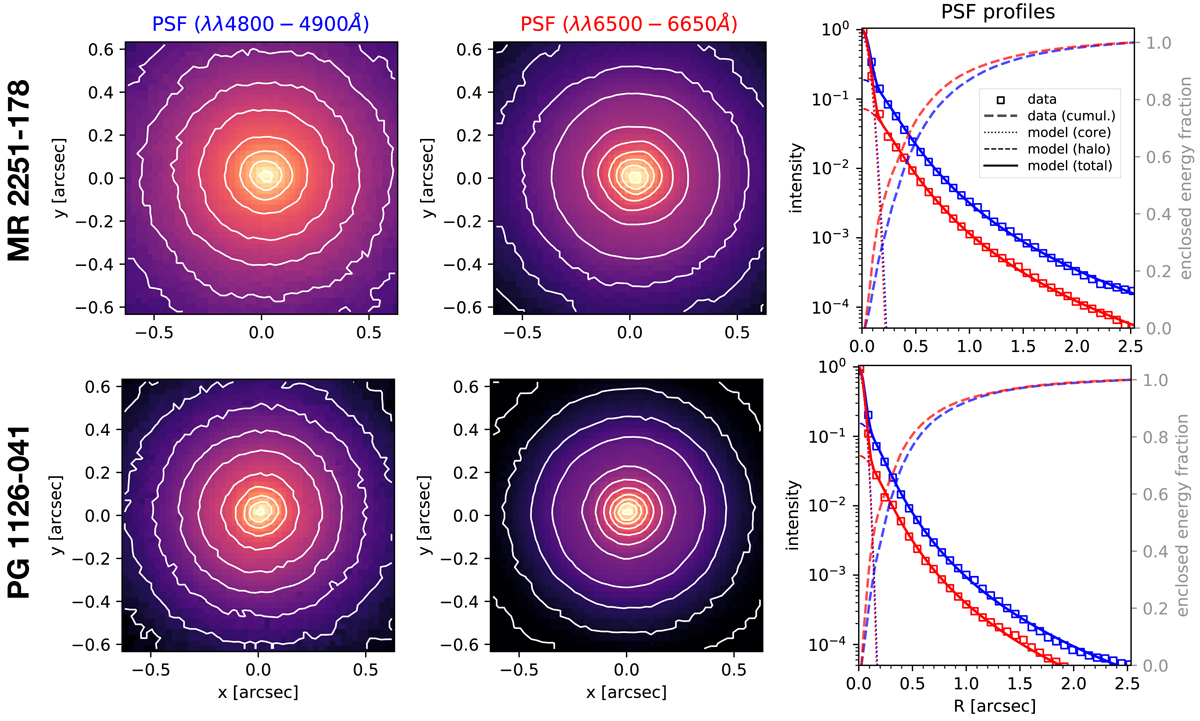
MUSE AO-assisted PSF for MR 2251−178 (top panels) and PG 1126−041 (bottom panels) as traced by intensity of BLR emission. Leftmost and central panels: separate PSF maps for the blue regime (λλ4800−4900 Å) and for the red regime (λλ6500−6650 Å). Each map is normalised to its peak value. Iso contours are the same for all maps and spaced by a factor of 2. Rightmost panels: azimuthally averaged PSF profiles (empty squares, one data point in every three is plotted for better clarity) and the enclosed energy fraction (thick dashed lines). The solid lines show our best-fit models, given by the sum of a Gaussian core (dotted lines) and a Moffat halo (thin dashed lines).
Current usage metrics show cumulative count of Article Views (full-text article views including HTML views, PDF and ePub downloads, according to the available data) and Abstracts Views on Vision4Press platform.
Data correspond to usage on the plateform after 2015. The current usage metrics is available 48-96 hours after online publication and is updated daily on week days.
Initial download of the metrics may take a while.