Fig. 1.
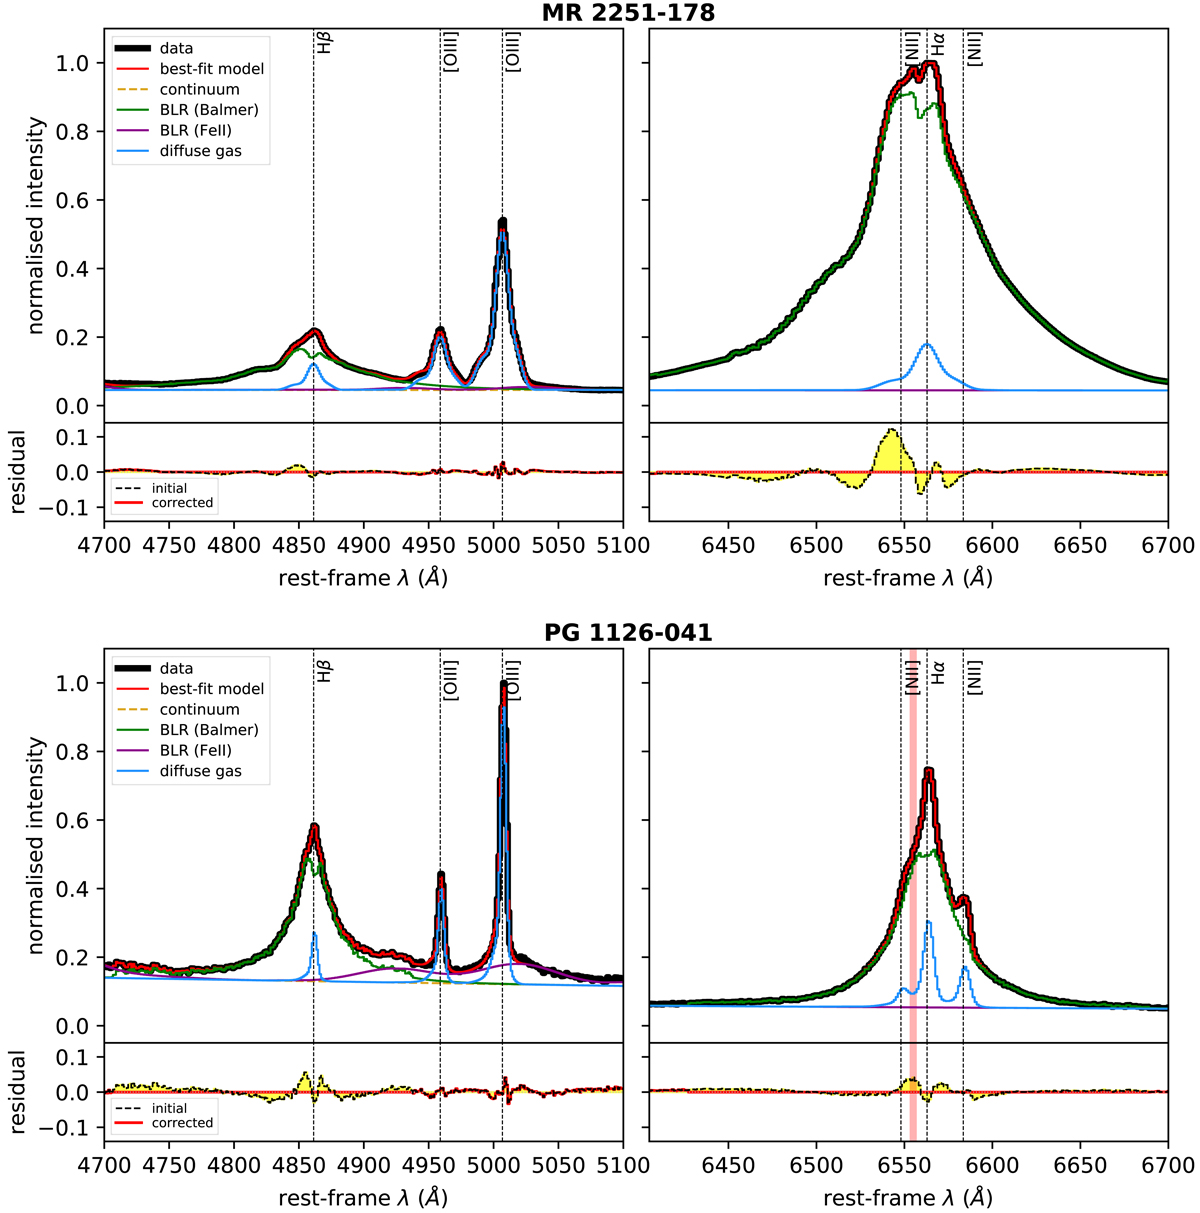
Representative regions of optical nuclear spectrum (solid black lines) for MR 2251−178 (upper panels) and PG 1126−041 (lower panels), along with their respective best-fit models (solid red lines). The left-hand panels focus on the Hβ and [O III] lines, while the right-hand panels are centred on the Hα and [N II] lines. The models are given by the sum of the [Fe II] and Balmer emission lines from the nuclear region (solid purple and green lines, respectively), diffuse gas emission from individual atomic species (solid blue lines), and a third-order polynomial (dashed yellow lines). Emission from diffuse gas is modelled with three Gaussian components. Residuals (data minus model) are shown below each panel; red solid (black dashed) lines are used for models with (without) the BLR correction term (see text). The red vertical band in the bottom-right panels marks a region contaminated by a sky-subtraction residual and is not fitted by our model.
Current usage metrics show cumulative count of Article Views (full-text article views including HTML views, PDF and ePub downloads, according to the available data) and Abstracts Views on Vision4Press platform.
Data correspond to usage on the plateform after 2015. The current usage metrics is available 48-96 hours after online publication and is updated daily on week days.
Initial download of the metrics may take a while.