Free Access
Fig. B.1.
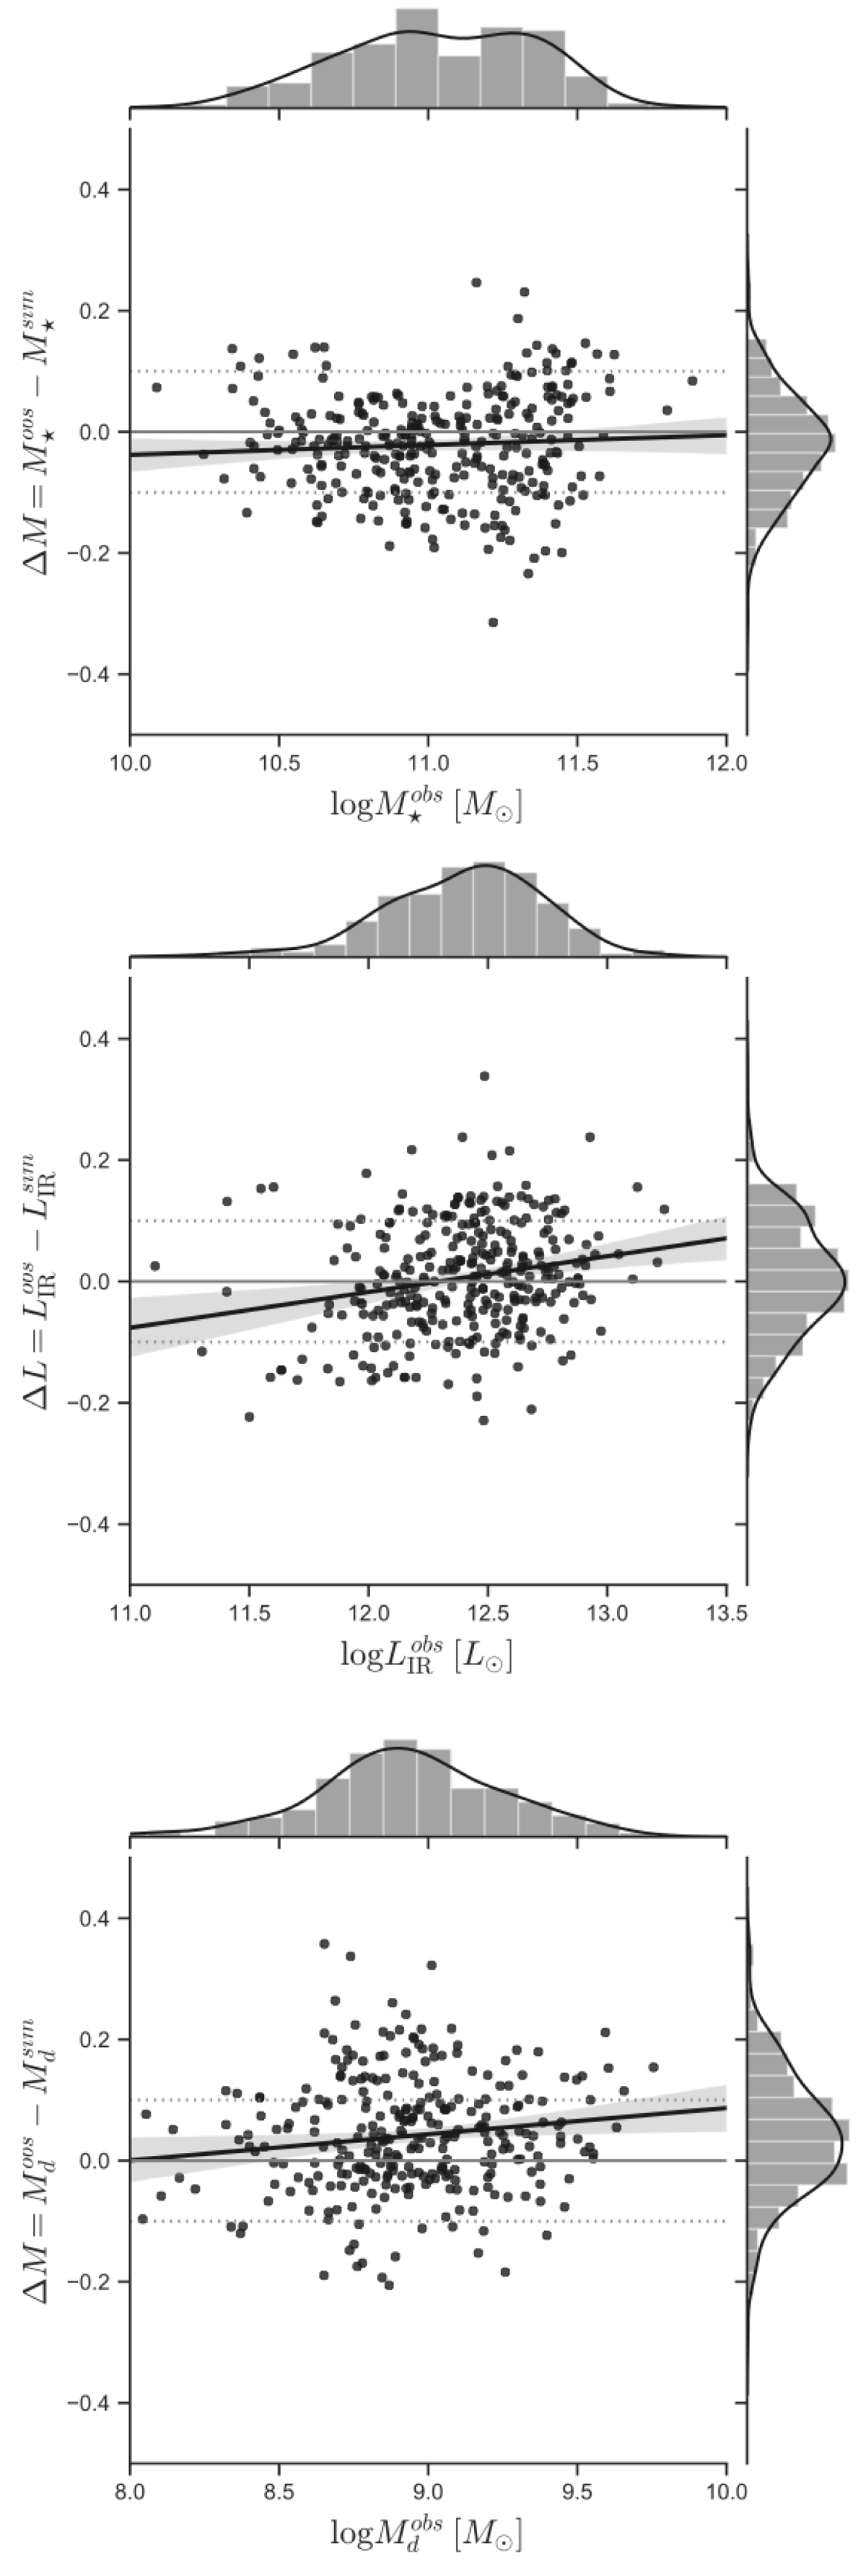
For each panel: offset between the estimated and simulated value. From top to bottom: stellar mass, dust mass and dust luminosity. The black line and the corresponding shaded region is the best linear regression fit to the parameter offset.
Current usage metrics show cumulative count of Article Views (full-text article views including HTML views, PDF and ePub downloads, according to the available data) and Abstracts Views on Vision4Press platform.
Data correspond to usage on the plateform after 2015. The current usage metrics is available 48-96 hours after online publication and is updated daily on week days.
Initial download of the metrics may take a while.