Fig. 7.
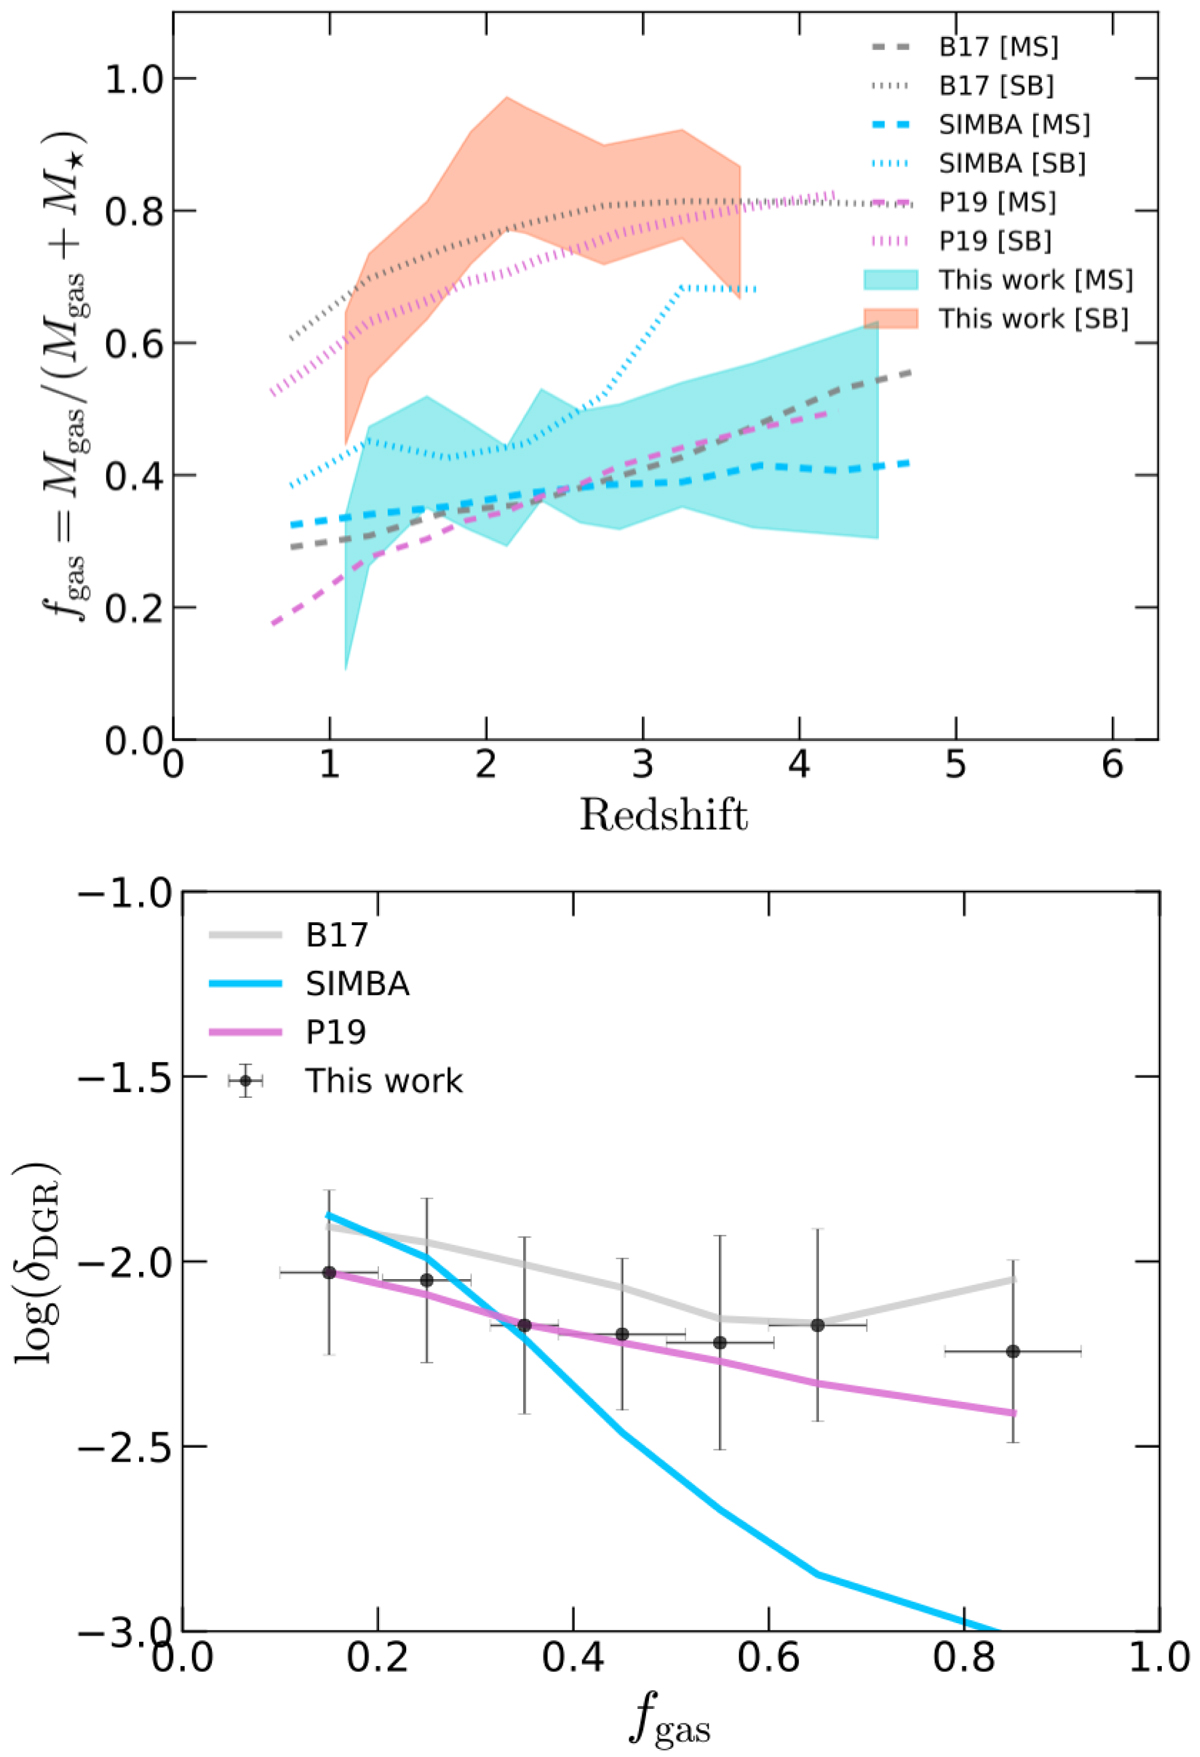
Upper panel: cosmic evolution of molecular gas fraction (fgas) in our DSFGs, estimated from the functional form of Liu et al. (2019a) and illustrated with shaded areas. The model predictions for MS and SB DSFGs are overplotted with dashed and dotted lines, respectively. Purple, blue, and grey lines correspond to P19, SIMBA, and B17 respectively. For P19 and SIMBA, the fgas is derived self-consistently, while for B17, we test the same scaling relation we apply in our observations. Lower panel: δDGR as a function of fgas for the full sample of observed and modelled galaxies. Observed mean ratios with corresponding 1σ uncertainty are presented with black circles. The significance of colours that correspond to modelled values is the same as in the upper panel.
Current usage metrics show cumulative count of Article Views (full-text article views including HTML views, PDF and ePub downloads, according to the available data) and Abstracts Views on Vision4Press platform.
Data correspond to usage on the plateform after 2015. The current usage metrics is available 48-96 hours after online publication and is updated daily on week days.
Initial download of the metrics may take a while.