Fig. 6.
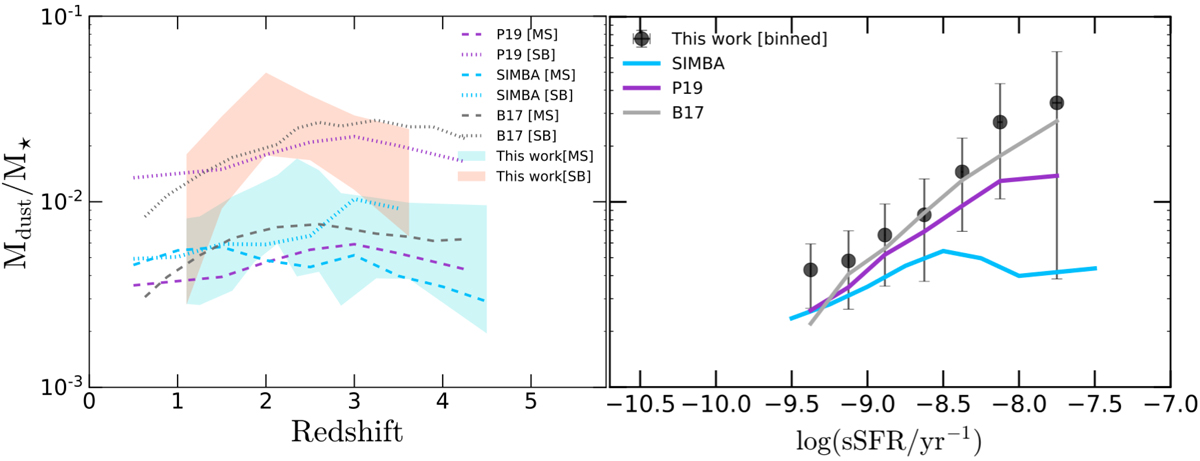
Left: redshift evolution of Mdust/M⋆ predicted by different models (see Sect. 5.1). The observed data are overplotted with same colours as in previous figures. The grey, blue, and purple dashed and dotted lines represent predictions for galaxies selected as MS and SB DSFGs from Béthermin et al. (2017), Davé et al. (2019) and Pantoni et al. (2019), respectively. Right: evolution of Mdust/M⋆ as a function of sSFR for the full sample of observed and modelled galaxies. The binned values from this work are shown with black circles with corresponding 1σ vertical error bars. The model predictions are denoted with same colours as in the left panel.
Current usage metrics show cumulative count of Article Views (full-text article views including HTML views, PDF and ePub downloads, according to the available data) and Abstracts Views on Vision4Press platform.
Data correspond to usage on the plateform after 2015. The current usage metrics is available 48-96 hours after online publication and is updated daily on week days.
Initial download of the metrics may take a while.