Fig. 4.
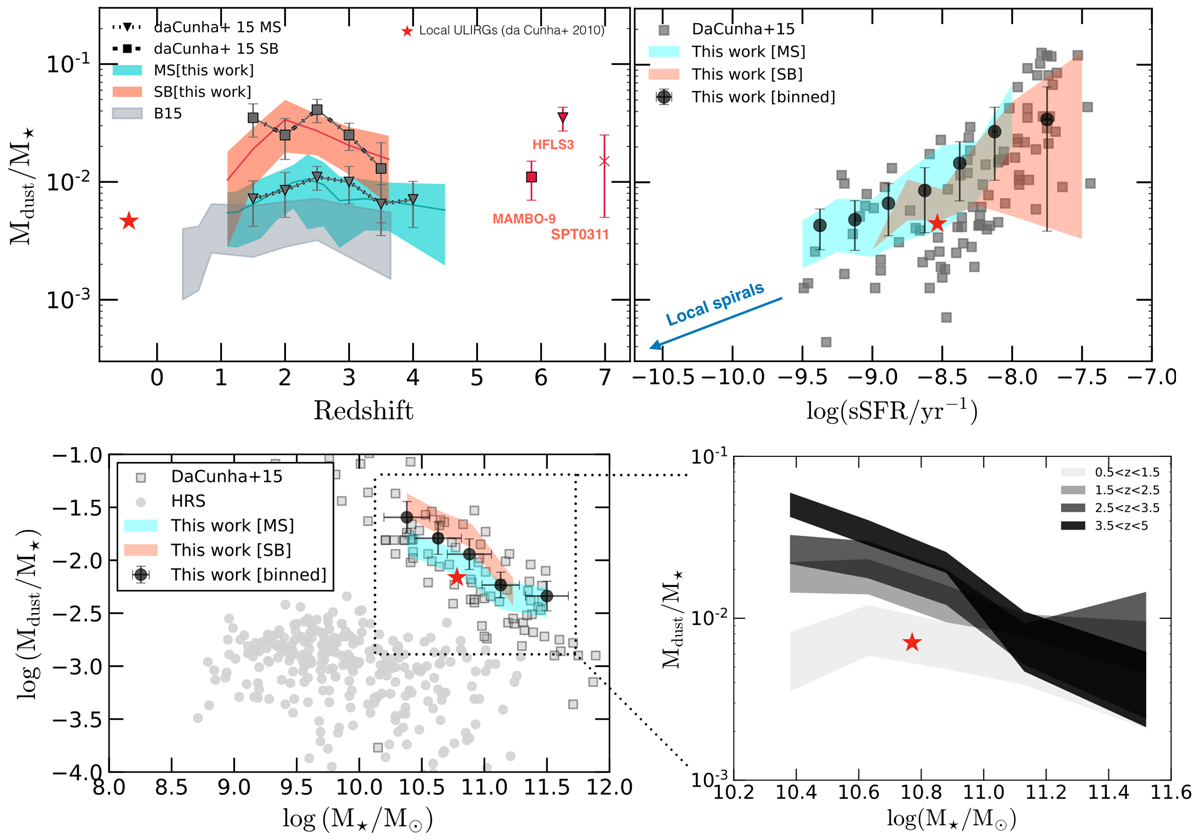
Top panel: Mdust/M⋆ versus redshfit (left) and sSFR (right), of our MS and SB DSFGs. The binned averages and corresponding standard errors for MS and SB subsample are shown as shaded dark cyan and orange area, respectively. The grey, shaded area is the observed trend obtained via stacking analysis by Béthermin et al. (2015). The red star in each panel indicate the median value of most extreme local ULIRGs (da Cunha et al. 2010). Binned values for MS and SB from high-redshift ALMA sample analysed by da Cunha et al. (2015) are shown with triangles and squares, respectively. Also displayed with red symbols are individual detections of the most distant DSFGs at z > 5 (MAMBO-9, Casey et al. 2019; Jin et al. 2019; HFLS3, Riechers et al. 2013; and SPT0311, Strandet et al. 2017). For consistency, we use public data and recalculate Mdust of latter three objects following our method, finding a good agreement with their archival estimates. Right panel: the binned mean values of the full sample are presented with black circles and the results from da Cunha et al. (2015) with filled squares. The error bars represent the dispersion (1σ) associated to the mean. Bottom panel: Mdust/M⋆ versus galaxy stellar mass. Left panel: our estimates compared to those that span the similar stellar mass range. Points are colour-coded in the same way as in the upper plot. Grey circles indicate the local galaxy sample composed of Herschel-detected galaxies (both passive and active) from the Virgo cluster (HRS, Andreani et al. 2018). On the right side, we resolve the overall trend of Mdust/M⋆ vs. M⋆ from this work per different redshift bins and plot the trend with corresponding 1σ uncertainty. Redshift bins are colour-coded as in the legend.
Current usage metrics show cumulative count of Article Views (full-text article views including HTML views, PDF and ePub downloads, according to the available data) and Abstracts Views on Vision4Press platform.
Data correspond to usage on the plateform after 2015. The current usage metrics is available 48-96 hours after online publication and is updated daily on week days.
Initial download of the metrics may take a while.