Fig. 3.
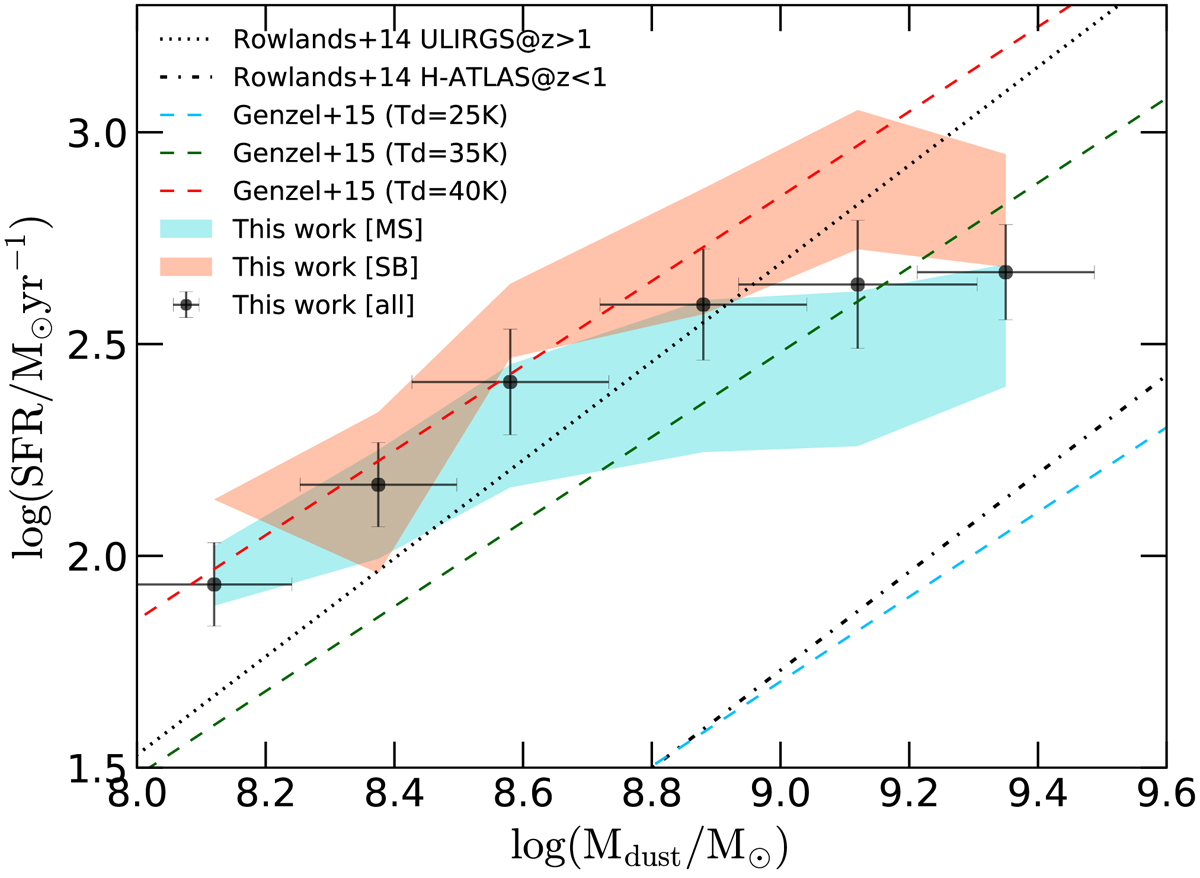
Observed relation between Mdust and SFR in our DSFGs, shown for the whole sample (binned means, shown as black circles) and divided on SB and MS galaxies (shaded in dark cyan and orange, respectively). The known, empirically based scaling relation between Tdust − SFR − Mdust (Genzel et al. 2015) are overlaid with dashed lines. Different colours correspond to their fixed Tdust, as indicated in the legend. The best fit for local and intermediate redshift ULIRGs (Rowlands et al. 2014) are displayed with dotted and dot-dashed line, respectively.
Current usage metrics show cumulative count of Article Views (full-text article views including HTML views, PDF and ePub downloads, according to the available data) and Abstracts Views on Vision4Press platform.
Data correspond to usage on the plateform after 2015. The current usage metrics is available 48-96 hours after online publication and is updated daily on week days.
Initial download of the metrics may take a while.