Fig. 2.
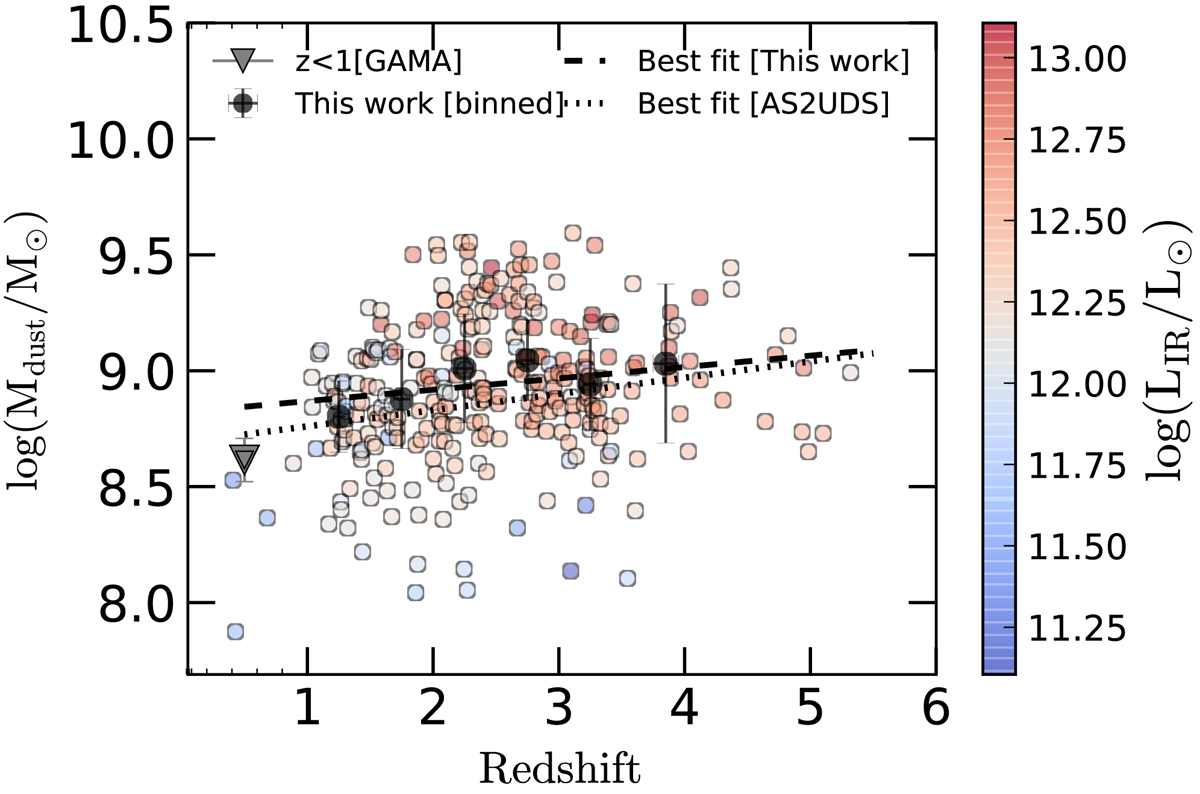
Observed redshift evolution of Mdust. Individual values are displayed with circles, coloured with corresponding LIR. Binned means are shown with black circles and associated 1σ errors. For comparison, we also show the mean Mdust for a large sample of dusty galaxies up to z ∼ 0.5 (Driver et al. 2018, black inverted triangle). The black dashed and dotted lines are best regression fits from this work and from Dudzevičiūtė et al. (2020), respectively.
Current usage metrics show cumulative count of Article Views (full-text article views including HTML views, PDF and ePub downloads, according to the available data) and Abstracts Views on Vision4Press platform.
Data correspond to usage on the plateform after 2015. The current usage metrics is available 48-96 hours after online publication and is updated daily on week days.
Initial download of the metrics may take a while.